
Climbing a mountain takes you, in a few hours, through what you would cross by travelling thousands of kilometres towards the pole.
It is a fine image. It is partly true, but one still needs to know where it stops being so.
Altitudinal zonation
As you climb, the vegetation changes in belts. Broadleaf forests, then conifers, then stunted shrubs, grasses and cushions of low-growing plants — until nothing is left but rock and snow.
This sequence closely resembles the one encountered when travelling from France towards the Far North.
The reason is that, in both cases, the limiting factor is the same: the heat available for growth.1
Where the image stops being true
The analogy has well-known limits, which should be set out clearly so as not to turn it into a simplistic model.
- Day length. At altitude, a summer day keeps the length set by its latitude. At the pole, the sun does not set for weeks, then disappears for months. This is an entirely different constraint for plant physiology.
- The seasons. A high-mountain plant undergoes a regular annual cycle of winter and summer. So does an Arctic plant, but in a radically different light environment.
- Radiation. At altitude, the layer of atmosphere is thinner: ultraviolet rays strike harder. Towards the poles, far from the equator, they are weaker instead.2
The analogy therefore works for temperature, but stops there. A useful comparison is not an identity. It is useful as long as one knows where it stops.3
A famous measurement — and why we have removed it
In this case, checking led us to remove a piece of data rather than add one. The story is worth telling.
The starting point
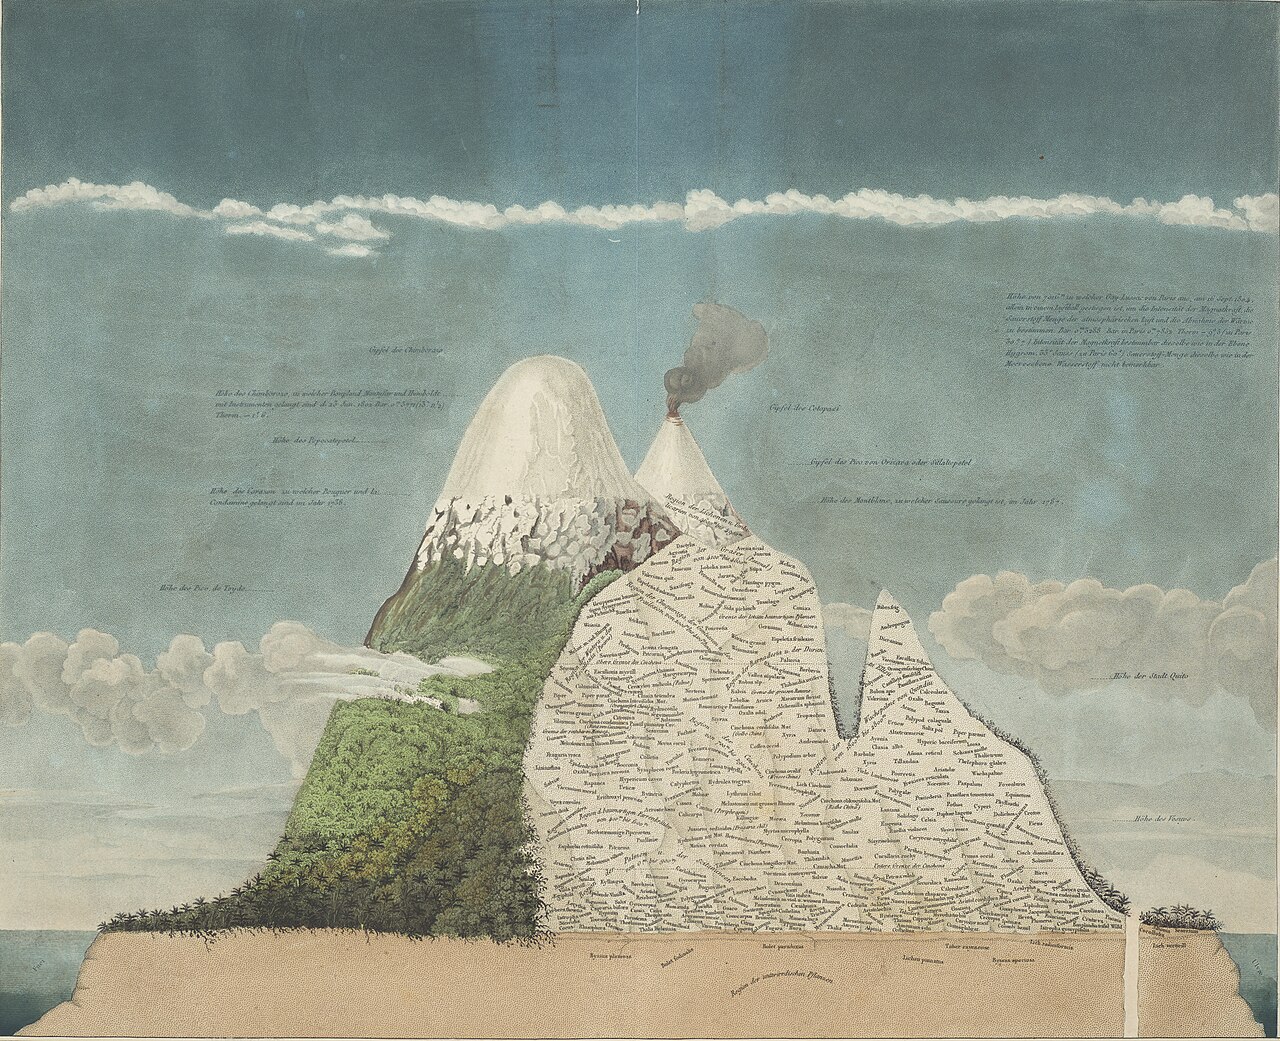
On 23 June 1802, Alexander von Humboldt attempted to climb Chimborazo, in Ecuador — he reached about 5,900 metres without making it to the summit (the sources give between 5,875 and 5,920 m, without settling the matter) and noted the distribution of vegetation with altitude. From this, in 1807, he produced his famous Tableau physique des Andes et pays voisins: a schematic cross-section of the mountain with its stacked belts.4
It is a founding document of modern ecology, showing that altitude organises living things just as latitude does.
How it was used
In 2012, a team of researchers went back to the site and repeated the surveys along fifteen transects.5
Result published in 2015: species had supposedly moved up by more than 500 metres on average since Humboldt. The spectacular figure was widely repeated: two centuries of warming measured by direct comparison with the work of a Romantic naturalist.
The refutation
In 2019, another team — historians working with ecologists — re-examined the original field notebooks and collections.6
First fact. Humboldt and Bonpland made no collections above 3,625 metres on Chimborazo. The vegetation limit used for the 2015 comparison therefore did not come from a field observation: it had been read off the drawing.7
Second fact, and the decisive one. The plants that Humboldt places at the top of his chart were not collected on Chimborazo: he had collected them on another mountain, Antisana.8
The Tableau physique is therefore not the cross-section of one mountain. It is a synthesis of several mountains, drawn on the outline of the most famous.
Third fact. Humboldt republished his chart twice. Each time, he reworked the upper part of the chart, and the list of plants placed at the very top changed — seventeen in 1807, twenty-three in 1817, thirty-two in 1824. Yet they are not the same: between the first and the second versions, only one species is shared.9
This point is essential. A field survey does not change when it is republished. A synthetic chart does. It is proof that this was a figure meant to show an idea, not to record measurements.
The detail that matters
The authors of the 2015 study had themselves pointed out the uncertainty in their original text. They noted that the comparison with Humboldt’s data was challenging and that reading the limits from his drawings was more uncertain.10
The researchers expressed their doubt; the media coverage lost it along the way. The mechanism is a classic one: the nuance appears in the scientific paper and disappears in popularisation.
Our decision
The figure of 500 metres will not be repeated here as an established fact.
Not because the upward shift of species at altitude is imaginary — it is amply documented by other methods — but because this particular measurement rests on reading a synthetic drawing, and a figure from 1807 is not a metric survey.11
Giving up a spectacular figure is part of working rigorously.
That leaves the lesson that the authors themselves draw from it, which holds for this whole site: using old data is anything but straightforward. It takes historians and scientists working together — the former to know how to read a document from the past, the latter to know what can be measured from it. On their own, they get it wrong.
These environments are not empty
A photograph of high mountains shows rock and snow. An image of the Arctic shows sea ice. People often conclude that nothing lives there. This is wrong on two counts:
- Plant life is very much present. The Arctic is home to more than two thousand plant species, adapted to extremely short growing seasons. Antarctica has very few, but not zero (only two flowering plants grow there naturally). High mountains, for their part, have a high rate of endemism.
- People live there. The polar and subpolar regions have been inhabited by Indigenous peoples for millennia.12
An environment described as empty is an environment poorly described.
Note 1
Here we suggest subdividing mountains vertically into seven thermal life zones (thermal belts) defined by temperature only and, thus, accounting for the latitudinal change in elevation of thermally similar areas. […] The transition from potentially forested to treeless terrain is co-defined by an empirically determined minimum duration of the growing season of 94 days and a mean growing season temperature of 6.4°C. […] The treeline may be located at a few hundred meters above sea level near the arctic circle, but may reach >4,000 m in the tropics and subtropics (as long as annual precipitation is >250 mm).
Körner, Christian, Paulsen, Jens and Spehn, Eva M., “A Definition of Mountains and Their Bioclimatic Belts for Global Comparisons of Biodiversity Data”, Alpine Botany, vol. 121, no. 2, 2011, p. 73 ff.
Note 2
Latitude: the closer to the equator, the higher the UVR levels. Altitude: UVR levels increase with altitude as the air is thinner and less UVR is absorbed.
World Health Organization, “Ultraviolet Radiation”, fact sheet
Astronomical daylength itself is strictly latitude-dependent (Figures 1A–D), thus its interest in the context of global warming has been marginal at best.
Cazzavillan, Anna, Abeli, Thomas, Brancaleoni, Lisa, Cutini, Maurizio, Tarascio, Martina and Gerdol, Renato, “Shedding light on arctic-alpine plants: the understudied photobiological responses in the context of climate change”, Frontiers in Plant Science, vol. 17, 2026, § 1
Note 3
Within a single species there is more chlorophyll in leaves of arctic populations than in those of alpine populations. […] (d) Alpine plants have higher light‐saturation values in photosynthesis than do arctic or lowland plants; light saturation closely tied to temperature.
Billings, William D. and Mooney, Harold A., “The Ecology of Arctic and Alpine Plants”, Biological Reviews, vol. 43, 1968, p. 481-529
Note 4
The printing of the French edition of the Essay began in February 1805, but it was published only in 1807. […] The charts Tableau physique / Naturgemälde appeared later in 1807
Renner, S. S., Päßler, U. and Moret, P., “"My Reputation is at Stake." Humboldt’s Mountain Plant Geography in the Making (1803–1825)”, Journal of the History of Biology, vol. 56, 2023, p. 97-124
Three years afterwards, almost on the same day (the 23d June 1802), I reached a point 6700 feet higher, near the summit of Chimborazo. […] According to La Place's barometrical formula, we had reached a height of 3016 toises, or more precisely 18,097 Paris feet.
Humboldt, Alexander von, “An Account of Two Attempts to Ascend Chimborazo”, The Albion, or British, Colonial, and Foreign Weekly Gazette, vol. 6, no. 2, 13 January 1838, p. 12-13; in Sämtliche Schriften digital, ed. Oliver Lubrich and Thomas Nehrlich, University of Bern, 2021
Note 5
We revisited Chimborazo in 2012, precisely 210 y after Humboldt’s expedition. […] We documented upward shifts in the distribution of vegetation zones as well as increases in maximum elevation limits of individual plant taxa of >500 m on average. […] We sampled a total of 15 transects from an elevation of 3,800 m at 100-m elevation intervals to 5,200 m, past the limit of plant growth.
Morueta-Holme, Naia et al., “Strong Upslope Shifts in Chimborazo’s Vegetation over Two Centuries since Humboldt”, Proceedings of the National Academy of Sciences, vol. 112, no. 41, 2015, p. 12741-12745
We revisited the upper slopes of the Chimborazo volcano in June 2012. Our aim was to record the current elevational distribution of plants and test for upward shifts since Humboldt’s expedition, as a response to anthropogenic global warming.
Morueta-Holme, Naia et al., “Strong Upslope Shifts in Chimborazo’s Vegetation over Two Centuries since Humboldt”, Proceedings of the National Academy of Sciences, vol. 112, no. 41, 2015, p. 12741-12745
Note 6
partnerships between historians and ecologists are needed to tease out the intermeshing and discrepancies of past and present biodiversity records
Moret, Pierre, Muriel, Priscilla, Jaramillo, Ricardo and Dangles, Olivier, “Humboldt’s Tableau Physique Revisited”, Proceedings of the National Academy of Sciences, vol. 116, no. 26, 2019, p. 12889-12894
Note 7
dass sich die Vegetationszone am Chimborazo seit Anfang des 19. Jahrhunderts um 500 Meter nach oben verschoben hätte: Humboldt und Bonpland hatten dort jenseits von 3625 Metern keine Pflanzen mehr gesammelt.
that the vegetation zone on Chimborazo had shifted upwards by 500 metres since the beginning of the 19th century: Humboldt and Bonpland had not collected any plants there above 3,625 metres.
Lingenhöhl, Daniel, “Ökologie: Wie sich Humboldts Vegetationszonen verändert haben”, Spektrum.de, 27 May 2019
Note 8
We found that Humboldt’s primary plant data above tree line were mostly collected on Mt. Antisana, not Chimborazo
Moret, Pierre, Muriel, Priscilla, Jaramillo, Ricardo and Dangles, Olivier, “Humboldt’s Tableau Physique Revisited”, Proceedings of the National Academy of Sciences, vol. 116, no. 26, 2019, p. 12889-12894
Note 9
the number of selected taxa placed above 3,900 m increases in each successive publication (17 in 1807, 23 in 1817, 32 in 1824), but these taxa are not the same. The 1807 set of vascular plants only shares one species-level taxon and two genera with that of 1817
Moret, Pierre, Muriel, Priscilla, Jaramillo, Ricardo and Dangles, Olivier, “Humboldt’s Tableau Physique Revisited”, Proceedings of the National Academy of Sciences, vol. 116, no. 26, 2019, p. 12889-12894
we show that the top section of the Tableau Physique, above the tree line, is an intuitive construct based on unverified and therefore partly false field data that Humboldt constantly tried to revise in subsequent publications.
Moret, Pierre, Muriel, Priscilla, Jaramillo, Ricardo and Dangles, Olivier, “Humboldt’s Tableau Physique Revisited”, Proceedings of the National Academy of Sciences, vol. 116, no. 26, 2019, p. 12889-12894
Note 10
Comparing the current distributions to the historical data is challenging due to the lack of a systematic design in the data collection by Humboldt. […] For images, we used visual estimation to extract information on elevation ranges (refs. 2 and 3 in Datasets S2 and S3). Because the method is more uncertain, we used both a broad and a narrow delimiting frame around the name of each taxon to record its altitudinal range.
Morueta-Holme, Naia et al., “Strong Upslope Shifts in Chimborazo’s Vegetation over Two Centuries since Humboldt”, Proceedings of the National Academy of Sciences, vol. 112, no. 41, 2015, p. 12741-12745
Note 11
Here we use a dataset of repeated plant surveys from 302 mountain summits across Europe, spanning 145 years of observation, to assess the temporal trajectory of mountain biodiversity changes as a globally coherent imprint of the Anthropocene. We find a continent-wide acceleration in the rate of increase in plant species richness, with five times as much species enrichment between 2007 and 2016 as fifty years ago, between 1957 and 1966.
Steinbauer, Manuel J. et al., “Accelerated Increase in Plant Species Richness on Mountain Summits Is Linked to Warming”, Nature, vol. 556, 2018, p. 231-234
Note 12
Approximately 2,218 vascular plant species (including subspecies, apomictic aggregates and some collective species) are recognized.
Daniëls, Fred J. A., Gillespie, Lynn J. and Poulin, Michel, “Plants”, dans Arctic Biodiversity Assessment, CAFF, 2013
The best-documented have been local population increases in the two flowering plant species native to the maritime Antarctic (102–104) and the inference of increased frequency of successful seed set (i.e., sexual reproduction) in concert with this (105).
Convey, Peter and Peck, Lloyd S., “Antarctic Environmental Change and Biological Responses”, Science Advances, vol. 5, eaaz0888, 2019
Notes and sources
- ↑
Passage As you climb, the vegetation changes in belts […] the limiting factor is the same: the heat available for growth
Here we suggest subdividing mountains vertically into seven thermal life zones (thermal belts) defined by temperature only and, thus, accounting for the latitudinal change in elevation of thermally similar areas. […] The transition from potentially forested to treeless terrain is co-defined by an empirically determined minimum duration of the growing season of 94 days and a mean growing season temperature of 6.4°C. […] The treeline may be located at a few hundred meters above sea level near the arctic circle, but may reach >4,000 m in the tropics and subtropics (as long as annual precipitation is >250 mm).
Source Körner, Christian, Paulsen, Jens and Spehn, Eva M., “A Definition of Mountains and Their Bioclimatic Belts for Global Comparisons of Biodiversity Data”, Alpine Botany, vol. 121, no. 2, 2011, p. 73 ff., sections “Seven thermal belts” and “High elevation treeline”.
Open access open the source · checked on 27 October 2026
- ↑
Passage At altitude, the layer of atmosphere is thinner: ultraviolet rays strike harder. Towards the poles, far from the equator, they are weaker instead.
Latitude: the closer to the equator, the higher the UVR levels. Altitude: UVR levels increase with altitude as the air is thinner and less UVR is absorbed.
Source World Health Organization, “Ultraviolet Radiation”, fact sheet, “Overview” section, factors affecting UV radiation.
Open access open the source · checked on 27 October 2026
Passage At altitude, a summer day keeps the length set by its latitude.
Astronomical daylength itself is strictly latitude-dependent (Figures 1A–D), thus its interest in the context of global warming has been marginal at best.
Source Cazzavillan, Anna, Abeli, Thomas, Brancaleoni, Lisa, Cutini, Maurizio, Tarascio, Martina and Gerdol, Renato, “Shedding light on arctic-alpine plants: the understudied photobiological responses in the context of climate change”, Frontiers in Plant Science, vol. 17, 2026, § 1, § 1 (“Introduction: warming is not enough to study climate change responses”), 2nd paragraph.
Open access open the source · checked on 27 October 2026
- ↑
Passage The analogy therefore works for temperature, but stops there.
Within a single species there is more chlorophyll in leaves of arctic populations than in those of alpine populations. […] (d) Alpine plants have higher light‐saturation values in photosynthesis than do arctic or lowland plants; light saturation closely tied to temperature.
Source Billings, William D. and Mooney, Harold A., “The Ecology of Arctic and Alpine Plants”, Biological Reviews, vol. 43, 1968, p. 481-529, the paper’s « Summary », points 4 and 5 (d).
Paywalled · checked on 25 October 2026
- ↑
Passage From this, in 1807, he produced his famous Tableau physique des Andes et pays voisins
The printing of the French edition of the Essay began in February 1805, but it was published only in 1807. […] The charts Tableau physique / Naturgemälde appeared later in 1807
Source Renner, S. S., Päßler, U. and Moret, P., “"My Reputation is at Stake." Humboldt’s Mountain Plant Geography in the Making (1803–1825)”, Journal of the History of Biology, vol. 56, 2023, p. 97-124, note 2.
Paywalled open the source · checked on 27 October 2026
Passage On 23 June 1802, Alexander von Humboldt attempted to climb Chimborazo, in Ecuador — he reached about 5,900 metres
Three years afterwards, almost on the same day (the 23d June 1802), I reached a point 6700 feet higher, near the summit of Chimborazo. […] According to La Place's barometrical formula, we had reached a height of 3016 toises, or more precisely 18,097 Paris feet.
Source Humboldt, Alexander von, “An Account of Two Attempts to Ascend Chimborazo”, The Albion, or British, Colonial, and Foreign Weekly Gazette, vol. 6, no. 2, 13 January 1838, p. 12-13; in Sämtliche Schriften digital, ed. Oliver Lubrich and Thomas Nehrlich, University of Bern, 2021, opening of the account (around the 12th paragraph), then the passage on the barometric measurement; conversion: 3,016 toises ≈ 5,878 m.
Open access open the source · checked on 27 October 2026
- ↑
Passage a team of researchers went back to the site and repeated the surveys along fifteen transects […] species had supposedly moved up by more than 500 metres on average
We revisited Chimborazo in 2012, precisely 210 y after Humboldt’s expedition. […] We documented upward shifts in the distribution of vegetation zones as well as increases in maximum elevation limits of individual plant taxa of >500 m on average. […] We sampled a total of 15 transects from an elevation of 3,800 m at 100-m elevation intervals to 5,200 m, past the limit of plant growth.
Source Morueta-Holme, Naia et al., “Strong Upslope Shifts in Chimborazo’s Vegetation over Two Centuries since Humboldt”, Proceedings of the National Academy of Sciences, vol. 112, no. 41, 2015, p. 12741-12745, abstract; « Materials and Methods » section.
Open access open the source · checked on 24 October 2026
Passage In 2012, a team of researchers went back to the site and repeated the surveys
We revisited the upper slopes of the Chimborazo volcano in June 2012. Our aim was to record the current elevational distribution of plants and test for upward shifts since Humboldt’s expedition, as a response to anthropogenic global warming.
Source Morueta-Holme, Naia et al., “Strong Upslope Shifts in Chimborazo’s Vegetation over Two Centuries since Humboldt”, Proceedings of the National Academy of Sciences, vol. 112, no. 41, 2015, p. 12741-12745, introduction (after the abstract).
Open access open the source · checked on 9 September 2026
- ↑
Passage historians working with ecologists
partnerships between historians and ecologists are needed to tease out the intermeshing and discrepancies of past and present biodiversity records
Source Moret, Pierre, Muriel, Priscilla, Jaramillo, Ricardo and Dangles, Olivier, “Humboldt’s Tableau Physique Revisited”, Proceedings of the National Academy of Sciences, vol. 116, no. 26, 2019, p. 12889-12894, « Significance » box (at the head of the paper).
Open access open the source · checked on 9 September 2026
- ↑
Passage Humboldt and Bonpland made no collections above 3,625 metres on Chimborazo.
dass sich die Vegetationszone am Chimborazo seit Anfang des 19. Jahrhunderts um 500 Meter nach oben verschoben hätte: Humboldt und Bonpland hatten dort jenseits von 3625 Metern keine Pflanzen mehr gesammelt.
Editors’ translation that the vegetation zone on Chimborazo had shifted upwards by 500 metres since the beginning of the 19th century: Humboldt and Bonpland had not collected any plants there above 3,625 metres.
Source Lingenhöhl, Daniel, “Ökologie: Wie sich Humboldts Vegetationszonen verändert haben”, Spektrum.de, 27 May 2019, body of the article.
Open access open the source · checked on 25 October 2026
- ↑
Passage he had collected them on another mountain, Antisana
We found that Humboldt’s primary plant data above tree line were mostly collected on Mt. Antisana, not Chimborazo
Source Moret, Pierre, Muriel, Priscilla, Jaramillo, Ricardo and Dangles, Olivier, “Humboldt’s Tableau Physique Revisited”, Proceedings of the National Academy of Sciences, vol. 116, no. 26, 2019, p. 12889-12894, abstract.
Open access open the source · checked on 9 September 2026
- ↑
Passage seventeen in 1807, twenty-three in 1817, thirty-two in 1824 […] between the first and the second versions, only one species is shared
the number of selected taxa placed above 3,900 m increases in each successive publication (17 in 1807, 23 in 1817, 32 in 1824), but these taxa are not the same. The 1807 set of vascular plants only shares one species-level taxon and two genera with that of 1817
Source Moret, Pierre, Muriel, Priscilla, Jaramillo, Ricardo and Dangles, Olivier, “Humboldt’s Tableau Physique Revisited”, Proceedings of the National Academy of Sciences, vol. 116, no. 26, 2019, p. 12889-12894, body of the article.
Open access open the source · checked on 9 September 2026
Passage Each time, he reworked the upper part of the chart
we show that the top section of the Tableau Physique, above the tree line, is an intuitive construct based on unverified and therefore partly false field data that Humboldt constantly tried to revise in subsequent publications.
Source Moret, Pierre, Muriel, Priscilla, Jaramillo, Ricardo and Dangles, Olivier, “Humboldt’s Tableau Physique Revisited”, Proceedings of the National Academy of Sciences, vol. 116, no. 26, 2019, p. 12889-12894, abstract.
Open access open the source · checked on 25 October 2026
- ↑
Passage The authors of the 2015 study had themselves pointed out the uncertainty in their original text. They noted that the comparison with Humboldt’s data was challenging and that reading the limits from his drawings was more uncertain.
Comparing the current distributions to the historical data is challenging due to the lack of a systematic design in the data collection by Humboldt. […] For images, we used visual estimation to extract information on elevation ranges (refs. 2 and 3 in Datasets S2 and S3). Because the method is more uncertain, we used both a broad and a narrow delimiting frame around the name of each taxon to record its altitudinal range.
Source Morueta-Holme, Naia et al., “Strong Upslope Shifts in Chimborazo’s Vegetation over Two Centuries since Humboldt”, Proceedings of the National Academy of Sciences, vol. 112, no. 41, 2015, p. 12741-12745, Materials and Methods, « Approaches to Elevation Range Comparison ».
Open access open the source · checked on 9 September 2026
- ↑
Passage it is amply documented by other methods
Here we use a dataset of repeated plant surveys from 302 mountain summits across Europe, spanning 145 years of observation, to assess the temporal trajectory of mountain biodiversity changes as a globally coherent imprint of the Anthropocene. We find a continent-wide acceleration in the rate of increase in plant species richness, with five times as much species enrichment between 2007 and 2016 as fifty years ago, between 1957 and 1966.
Source Steinbauer, Manuel J. et al., “Accelerated Increase in Plant Species Richness on Mountain Summits Is Linked to Warming”, Nature, vol. 556, 2018, p. 231-234, abstract.
Paywalled · checked on 25 October 2026
- ↑
Passage The Arctic is home to more than two thousand plant species
Approximately 2,218 vascular plant species (including subspecies, apomictic aggregates and some collective species) are recognized.
Source Daniëls, Fred J. A., Gillespie, Lynn J. and Poulin, Michel, “Plants”, dans Arctic Biodiversity Assessment, CAFF, 2013, overview page of chapter 9 « Plants » (report website).
Open access open the source · checked on 9 September 2026
Passage only two flowering plants grow there naturally
The best-documented have been local population increases in the two flowering plant species native to the maritime Antarctic (102–104) and the inference of increased frequency of successful seed set (i.e., sexual reproduction) in concert with this (105).
Source Convey, Peter and Peck, Lloyd S., “Antarctic Environmental Change and Biological Responses”, Science Advances, vol. 5, eaaz0888, 2019, p. 3, section « Sensitivity to Environmental Change », subsection « Terrestrial ».
Open access · checked on 24 October 2026
Bibliography
14
- Billings, William D. and Mooney, Harold A., “The Ecology of Arctic and Alpine Plants”, Biological Reviews, vol. 43, 1968, p. 481-529, paywalled (the alpine/Arctic comparison and its limits).
- Cazzavillan, Anna, Abeli, Thomas, Brancaleoni, Lisa, Cutini, Maurizio, Tarascio, Martina and Gerdol, Renato, “Shedding light on arctic-alpine plants: the understudied photobiological responses in the context of climate change”, Frontiers in Plant Science, vol. 17, 2026, open access (astronomical day length, which depends strictly on latitude). https://doi.org/10.3389/fpls.2026.1920913
- Convey, Peter and Peck, Lloyd S., “Antarctic Environmental Change and Biological Responses”, Science Advances, vol. 5, eaaz0888, 2019, open access (Antarctica’s only two flowering plants).
- Daniëls, Fred J. A., Gillespie, Lynn J. and Poulin, Michel, “Plants”, dans Arctic Biodiversity Assessment, CAFF, 2013, open access (some 2,218 vascular plant species recognised in the Arctic). https://www.arcticbiodiversity.is/the-report/chapters/plants
- Humboldt, Alexander von and Bonpland, Aimé, Essai sur la géographie des plantes, accompagné d’un tableau physique des régions équinoxiales, Levrault & Schoell, Paris, 1807 (printing begun in 1805), public domain (the Tableau physique des Andes et pays voisins). https://www.biodiversitylibrary.org/bibliography/9309
- Humboldt, Alexander von, “An Account of Two Attempts to Ascend Chimborazo”, The Albion, or British, Colonial, and Foreign Weekly Gazette, vol. 6, no. 2, 13 January 1838, p. 12-13; in Sämtliche Schriften digital, ed. Oliver Lubrich and Thomas Nehrlich, University of Bern, 2021, open access (the ascent of 23 June 1802 to 3,016 toises, near the summit). https://humboldt.unibe.ch/text/1837-Ueber_zwei_Versuche-07-neu
- Körner, Christian, Alpine Plant Life: Functional Plant Ecology of High Mountain Ecosystems, Springer, 2021, in libraries (altitudinal zonation, the tree line, the differences between altitude and latitude: day length, ultraviolet radiation).
- Körner, Christian, Paulsen, Jens and Spehn, Eva M., “A Definition of Mountains and Their Bioclimatic Belts for Global Comparisons of Biodiversity Data”, Alpine Botany, vol. 121, no. 2, 2011, p. 73 ff., open access. https://doi.org/10.1007/s00035-011-0094-4
- Lingenhöhl, Daniel, “Ökologie: Wie sich Humboldts Vegetationszonen verändert haben”, Spektrum.de, 27 May 2019, open access (a report on the paper by Moret et al.: no plants collected by Humboldt and Bonpland above 3,625 m on Chimborazo; the altitude data coming from Antisana). https://www.spektrum.de/news/wie-sich-humboldts-vegetationszonen-veraendert-haben/1647876
- Moret, Pierre, Muriel, Priscilla, Jaramillo, Ricardo and Dangles, Olivier, “Humboldt’s Tableau Physique Revisited”, Proceedings of the National Academy of Sciences, vol. 116, no. 26, 2019, p. 12889-12894, open access (no collections above 3,625 m on Chimborazo; the high-altitude plants actually collected on Antisana; the number of taxa above 3,900 m rising from 17 to 23 and then 32 from one edition to the next, with very few species in common; the call for historians and ecologists to work together). http://www.riversimulator.org/Resources/ClimateDocs/HumbildtsTableauPhysiqueRevisited2019Moret.pdf
- Morueta-Holme, Naia et al., “Strong Upslope Shifts in Chimborazo’s Vegetation over Two Centuries since Humboldt”, Proceedings of the National Academy of Sciences, vol. 112, no. 41, 2015, p. 12741-12745, open access (the fifteen transects, the upward shift of more than 500 metres, and the authors’ reservations about reading the figure) ; et leur réponse, ibid., vol. 116, 2019, p. 21346-21347, open access. https://pmc.ncbi.nlm.nih.gov/articles/PMC4611603
- Renner, S. S., Päßler, U. and Moret, P., “"My Reputation is at Stake." Humboldt’s Mountain Plant Geography in the Making (1803–1825)”, Journal of the History of Biology, vol. 56, 2023, p. 97-124, paywalled (printing of the Essai begun in 1805; text and Tableau physique published in 1807). https://doi.org/10.1007/s10739-023-09705-z
- Steinbauer, Manuel J. et al., “Accelerated Increase in Plant Species Richness on Mountain Summits Is Linked to Warming”, Nature, vol. 556, 2018, p. 231-234, paywalled (the upward shift of species documented by other methods: repeated surveys of European summits).
- World Health Organization, “Ultraviolet Radiation”, fact sheet, open access. https://www.who.int/news-room/fact-sheets/detail/ultraviolet-radiation
Spotted an error or have a doubt? Write to us.