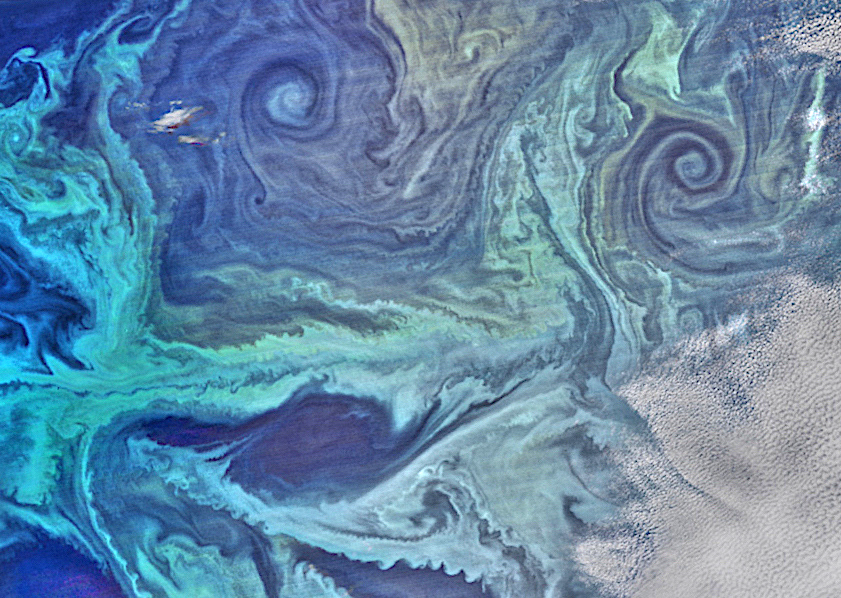

The ocean produces half of the Earth’s oxygen. But marine life consumes roughly as much.1
Stopping at the first sentence amounts to rebuilding the myth we take apart in our page on the Amazon — simply moved into the water.
The complete sentence
The oceanographic agency that produces this figure pairs it with a second part, almost never quoted:
marine life consumes roughly as much oxygen as it produces.2
Plankton respires. It is eaten by zooplankton, which also respires. When the cells die and sink, bacteria decompose them — consuming oxygen as they do.
The account balances out at roughly zero, as in a forest.
A notion this site had not yet named
This page sets out a distinction that applies everywhere, and that accounts for half of the misunderstood figures one comes across.
A flow is not a stock.
A flow is what passes through. An output, a circulation, a rate. A stock is what remains. A reserve, a total, a quantity present.
The “half of the oxygen” figure describes a flow: the share of annual production that comes from the ocean.3
It does not say that half of the oxygen molecules present in the atmosphere come from there. That would be a stock, and it is another question, with another answer.
Confusing the two produces false claims with accurate figures. That is what makes the error so hard to spot: there is nothing to correct in the number.
Two clarifications, and the second changes everything
The first concerns the figure itself. Official estimates speak of roughly half, with no exact figure — because the amounts are constantly changing and they are measured by satellite, which does not show everything.4
The second is more important, and it is almost never mentioned. The ocean consumes roughly as much oxygen as it produces. Marine organisms respire, and the decomposition of dead cells also consumes it.
In other words, this enormous flow is not added to the stock: it circulates in a closed loop.
Where, then, does the oxygen we breathe come from? From the stock accumulated over hundreds of millions of years — the time it took for a small fraction of dead matter to escape decomposition by being buried in sediments.5
A molecule of oxygen stays in the atmosphere for a few thousand years on average. This reasoning reappears in our page on the water cycle: one and the same system contains reservoirs that renew themselves at vastly different rates.
Seagrass meadows, and the greatest uncertainty in the field
Seagrass meadows are underwater prairies: true flowering plants that returned to live in the sea.
They are among the environments on the planet that accumulate carbon most efficiently. Some store several hundred tonnes of carbon per hectare in their sediments, and they accumulate it much faster, area for area, than land forests.6
No one knows how many there are.
No one knows what area they cover
The areas actually mapped range from about 160,000 to 600,000 square kilometres depending on the synthesis — a factor of nearly four between the lower and upper bounds; studies that attempt to estimate the potential extent through modelling, rather than mapping, arrive at values up to ten times higher.7
The distinction is essential: what is mapped is not what exists. An upper bound derived from a model and a lower bound derived from a map cannot be compared.
It is, by the specialists’ own admission, the largest source of uncertainty in all marine carbon inventories. All the rest of the calculation can be precise: if the area is unknown to within a factor of four, so is the result.
The most uncertain figure governs all the others.
An instructive revision
In 2025, a study based on more than 2,700 sediment cores revised the stocks downwards: the median value is 24.2 tonnes of carbon per hectare in the top thirty centimetres of soil — that is, 27% less than earlier syntheses.8
Why the gap? Because measurements had not been taken everywhere. The first measurements mainly concerned seagrass meadows very rich in carbon; some regions and species had been little studied.9
Yet Mediterranean seagrass meadows are among the richest in the world: it was mainly they that supplied the very high values.10
So the best ones had been measured, and the others assumed to resemble them.
No one had cheated. Measurements had been taken where measurements were taken — and then generalised.
Note, finally, the range the authors publish around their median: from 12 to 45 tonnes per hectare. The stock varies fourfold depending on the plant species and the type of coast. A single value, for this kind of environment, would make no sense.11
The decline, for its part, has long been documented. A 2009 synthesis bringing together the surveys available since 1879 estimates that about 29% of the known area of seagrass meadows has disappeared, and that the rate of loss has risen from 0.9% to 7% per year.12
This is exactly the bias encountered elsewhere on this site: what was easiest to find was described first, and the catalogue ended up passing for the world.
The decline, and a nuance
Two figures circulate for the same thing: 29% loss in one case, about 20% in the other. This is not an error but a difference in scope — the first value concerns the area of seagrass meadows actually surveyed since 1879, the second an estimate of global extent. It is the order of magnitude that should be remembered: between a fifth and a third lost in a little over a century.
The acceleration, for its part, is the best-established fact: the annual rate of loss rose from less than 1% to about 7% in the 1990s and 2000s.
But recoveries are documented in some regions, including Europe. The trend is not the same everywhere, and an honest page must say so.13
What is the point of calculating all this? The 2025 authors answer: to better guide their protection. They estimate that the carbon in threatened seagrass meadows represents, if it were released, more than a billion tonnes of carbon dioxide. Knowing how it varies from one place to another is not precision for its own sake: it is what makes it possible to choose.14
Underwater forests: the forgotten giant
Much is said about seagrass meadows. Much less is said about the forests of large seaweeds (laminarians, or kelp).
According to a recent estimate, they cover about two million square kilometres, nearly six times the area of seagrass meadows.15
⚠ This ratio depends on the estimates used for each of the two areas, and it must be given as such. In this field, almost all figures are ranges — and the reader deserves to know this rather than be given a reassuring and false number.
Anchored to the rocky bottoms of cold and temperate coasts, these extraordinary plant structures can grow by several tens of centimetres a day. Unlike seagrass meadows, they do not store carbon in the ground beneath them — they have neither roots nor true sediment.16
Their storage mechanism relies on another route: export. Storms tear off fragments of seaweed that are carried out to the open sea and the deep ocean. Once it has sunk below a few hundred metres, the organic matter escapes rapid decomposition and traps the carbon for centuries.17
Where does the oxygen really come from?
The answer is the same as in our page on tropical forests, and it is worth repeating.
Oxygen accumulates only when carbon escapes decomposition.18
If everything that grows ends up rotting, all the oxygen produced is taken back. For the stock to increase, part of the organic matter must be buried without having rotted.
That is what happened, in very large quantities, over hundreds of millions of years. The air we breathe is the result.
And what about algae?
One last point, of a kind now familiar on this site.
“Alga” is not a group.
The word brings together organisms that are not closely related to one another — and it even includes photosynthetic bacteria (cyanobacteria, or “blue-green algae”), which are not plants at all, nor even organisms with complex cells.
On the tree of life, a brown alga (such as kelp or sargassum) is genetically closer to a potato parasite or a diatom than to a green alga. The green alga, for its part, belongs to the lineage of land plants (the green lineage).19
It is a convenient box, based on a shared way of life: it lives in water, it photosynthesises, it has neither stem nor root.
A box of everyday language, not a box of kinship. Like “fish”. Like “reptile”. Like “tree”.
They are not wrong. They simply do not say what people think.
The safeguards: acidification and blooms
No account of marine plants would be complete without the two limits that shatter this picture.
1. Acidification and marine heatwaves
The ocean absorbs about a quarter of our CO₂ emissions. This alters the chemistry of the water: the pH falls. While the first organisms affected are those with calcified shells, warming waters hit kelp forests head-on. An underwater heatwave can wipe out the kelp forest along some hundred kilometres of coast, replacing it with a carpet of low-growing seaweed and with species from tropical seas.20
2. Algal blooms (green tides)
When the flow of nutrients (notably agricultural nitrates) surges in coastal areas, certain algae proliferate to the point of suffocating the environment. This is eutrophication: the biomass becomes so enormous that, when it dies, its decomposition consumes a large part of the dissolved oxygen at the bottom of the water. The plant produces oxygen by day, but its overabundance creates hypoxic dead zones at night.21
Note 1
although the ocean produces at least 50% of the oxygen on Earth, roughly the same amount is consumed by marine life
National Oceanic and Atmospheric Administration, “How Much Oxygen Comes from the Ocean?”, National Ocean Service, page mise à jour le 23 September 2026, open access
Note 2
although the ocean produces at least 50% of the oxygen on Earth, roughly the same amount is consumed by marine life
National Oceanic and Atmospheric Administration, “How Much Oxygen Comes from the Ocean?”, National Ocean Service, page mise à jour le 23 September 2026, open access
Note 3
Integrating conceptually similar models of the growth of marine and terrestrial primary producers yielded an estimated global net primary production (NPP) of 104.9 petagrams of carbon per year, with roughly equal contributions from land and oceans.
Field, Christopher B., Behrenfeld, Michael J., Randerson, James T. and Falkowski, Paul, “Primary Production of the Biosphere: Integrating Terrestrial and Oceanic Components”, Science, vol. 281, 1998, p. 237-240
Note 4
Scientists estimate that roughly half of the oxygen production on Earth comes from the ocean.
National Oceanic and Atmospheric Administration, “How Much Oxygen Comes from the Ocean?”, National Ocean Service, page mise à jour le 23 September 2026, open access
Calculating the exact percentage of oxygen produced in the ocean is difficult because the amounts are constantly changing […] but satellite imagery cannot tell the whole story.
National Oceanic and Atmospheric Administration, “How Much Oxygen Comes from the Ocean?”, National Ocean Service, page mise à jour le 23 September 2026, open access
Note 5
There is also oxygen in the atmosphere which has accumulated over hundreds of millions of years. As land animals, most of the oxygen humans breathe comes from this source.
National Oceanic and Atmospheric Administration, “How Much Oxygen Comes from the Ocean?”, National Ocean Service, page mise à jour le 23 September 2026, open access
Note 6
Four sites fell below the globally documented range of 115.5–829.2 Mg C ha⁻¹ (from 41 100cm cores) […]
Green, A., Chadwick, M. A. and Jones, P. J. S., “Variability of UK Seagrass Sediment Carbon: Implications for Blue Carbon Estimates and Marine Conservation Management”, PLoS ONE, vol. 13, no. 9, e0204431, 2018
Atmospheric carbon is captured by coastal mangroves, seagrasses and salt marshes at a rate five times faster than tropical forests.
Reynolds, Pamela L., “Seagrass and Seagrass Beds”, Smithsonian Ocean, National Museum of Natural History, page consulted on 27 October 2026
Note 7
Estimates of global seagrass spatial distribution differ greatly throughout the published literature, ranging from 177 000 to 600 000 km2 with models suggesting potential distribution an order of magnitude higher. […] we have estimated with Moderate to High confidence the global seagrass area to date as 160 387 km2
McKenzie, Len J. et al., “The Global Distribution of Seagrass Meadows”, Environmental Research Letters, vol. 15, 074041, 2020
Note 8
analyses of a comprehensive global database including 2700+ seagrass soil cores
Krause, Johannes R. et al., “Global Seagrass Carbon Stock Variability and Emissions from Seagrass Loss”, Nature Communications, vol. 16, 3798, 2025
The median global soil Corg stock estimate is 24.2 (12.4 – 44.9) Mg Corg ha−1 in the top 30 cm of soil, 27% lower than estimates from previous global syntheses
Krause, Johannes R. et al., “Global Seagrass Carbon Stock Variability and Emissions from Seagrass Loss”, Nature Communications, vol. 16, 3798, 2025
Note 9
early available data were biased toward seagrass habitats with high soil Corg stocks […] the global scientific community has made considerable effort to generate data for previously understudied regions, seagrass taxa, and environments
Krause, Johannes R. et al., “Global Seagrass Carbon Stock Variability and Emissions from Seagrass Loss”, Nature Communications, vol. 16, 3798, 2025
Note 10
These Corg stock data were skewed high by very large stock estimates (mostly from Mediterranean Posidonia oceanica meadows)
Krause, Johannes R. et al., “Global Seagrass Carbon Stock Variability and Emissions from Seagrass Loss”, Nature Communications, vol. 16, 3798, 2025
Note 11
24.2 (12.4 – 44.9) Mg Corg ha−1 […] biogeographical (coastal typology, marine ecoregion) as well as taxonomic (seagrass species, genus, and functional group) predictors were significant
Krause, Johannes R. et al., “Global Seagrass Carbon Stock Variability and Emissions from Seagrass Loss”, Nature Communications, vol. 16, 3798, 2025
Note 12
Our comprehensive global assessment of 215 studies found that seagrasses have been disappearing at a rate of 110 km2 yr−1 since 1980 and that 29% of the known areal extent has disappeared since seagrass areas were initially recorded in 1879. Furthermore, rates of decline have accelerated from a median of 0.9% yr−1 before 1940 to 7% yr−1 since 1990.
Waycott, Michelle et al., “Accelerating Loss of Seagrasses across the Globe Threatens Coastal Ecosystems”, Proceedings of the National Academy of Sciences, vol. 106, 2009, p. 12377-12381
Note 13
Since then, loss rates slowed down for most of the species and fast-growing species recovered in some locations, making the net rate of change in seagrass area experience a reversal in the 2000s, while density metrics improved or remained stable in most sites.
de los Santos, Carmen B. et al., “Recent Trend Reversal for Declining European Seagrass Meadows”, Nature Communications, vol. 10, 3356, 2019
Note 14
We estimate that seagrass carbon stocks at risk of degradation could emit 1,154 Tg (665 – 1699) CO2 […] Greater knowledge of the variation in, and drivers of, seagrass Corg stocks is essential to guide the development, integrity, and reliability of climate change policy and financing to support seagrass conservation and restoration.
Krause, Johannes R. et al., “Global Seagrass Carbon Stock Variability and Emissions from Seagrass Loss”, Nature Communications, vol. 16, 3798, 2025
Note 15
This value compares favourably with recent efforts to assess the global extent of kelp habitat […] which is estimated at 2.03 × 10⁶ km2 (Jayathilake & Costello, 2021) […] the total area of seagrasses (0.35 × 10⁶ km2, Duarte, 2017)
Duarte, Carlos M. et al., “Global Estimates of the Extent and Production of Macroalgal Forests”, Global Ecology and Biogeography, vol. 31, no. 7, 2022, p. 1422-1439
Note 16
In ideal conditions, kelp can grow up to 18 inches per day […]
NOAA National Ocean Service, “What is a kelp forest?”, Ocean Facts
Note 17
We propose two main modes for the transport of macroalgae to the deep ocean and sediments: macroalgal material drifting through submarine canyons, and the sinking of negatively buoyant macroalgal detritus.
Krause-Jensen, Dorte and Duarte, Carlos M., “Substantial Role of Macroalgae in Marine Carbon Sequestration”, Nature Geoscience, vol. 9, 2016, p. 737-742
Note 18
And for oxygen to build up in our atmosphere, plant organic matter must be protected from oxidation. […] Continual burial of carbon is needed to keep the atmosphere pumped up with oxygen.
Tenenbaum, David, “Fossil fuel formation: Key to atmosphere’s oxygen?”, College of Letters & Science, University of Wisconsin–Madison, 30 December 2016
Note 19
It may seem hard to believe that microscopic diatoms, with their delicate silica skeletons […] can be related to the giant kelps, which may grow as long as fifty meters, or that either one is related to the downy mildew that nearly destroyed the French wine industry. […] Even though they are photosynthetic, chromists are not at all closely related to plants, or even to other algae.
University of California Museum of Paleontology, “Introduction to the Chromista”, page consulted on 27 October 2026
Stramenopiles: Diatoms, Brown Algae, Golden Algae and Oomycetes […] Most oomycetes are aquatic, but some parasitize terrestrial plants. One plant pathogen is Phytophthora infestans, the causative agent of late blight of potatoes, such as occurred in the nineteenth century Irish potato famine.
Clark, Mary Ann, Douglas, Matthew and Choi, Jung, Biology 2e, OpenStax, 2018, section 23.3 “Groups of Protists”
Note 20
Rising atmospheric carbon dioxide (CO2), primarily from human fossil fuel combustion, reduces ocean pH and causes wholesale shifts in seawater carbonate chemistry.
Doney, Scott C. et al., “Ocean Acidification: The Other CO₂ Problem”, Annual Review of Marine Science, vol. 1, 2009, p. 169-192
Here we reveal a rapid climate-driven regime shift of Australian temperate reef communities, which lost their defining kelp forests and became dominated by persistent seaweed turfs. After decades of ocean warming, extreme marine heat waves forced a 100-kilometer range contraction of extensive kelp forests
Wernberg, Thomas et al., “Climate-driven Regime Shift of a Temperate Marine Ecosystem”, Science, vol. 353, 2016, p. 169-172
Note 21
Enhanced primary production results in an accumulation of particulate organic matter, which encourages microbial activity and the consumption of dissolved oxygen in bottom waters.
Diaz, Robert J. and Rosenberg, Rutger, “Spreading Dead Zones and Consequences for Marine Ecosystems”, Science, vol. 321, 2008, p. 926-929
Notes and sources
- ↑
Passage The ocean consumes roughly as much oxygen as it produces.
although the ocean produces at least 50% of the oxygen on Earth, roughly the same amount is consumed by marine life
Source National Oceanic and Atmospheric Administration, “How Much Oxygen Comes from the Ocean?”, National Ocean Service, page mise à jour le 23 September 2026, open access, “How much oxygen comes from the ocean?” fact sheet.
Open access open the source · checked on 24 October 2026
- ↑
Passage marine life consumes roughly as much oxygen as it produces
although the ocean produces at least 50% of the oxygen on Earth, roughly the same amount is consumed by marine life
Source National Oceanic and Atmospheric Administration, “How Much Oxygen Comes from the Ocean?”, National Ocean Service, page mise à jour le 23 September 2026, open access, explanatory page.
Open access open the source · checked on 24 October 2026
- ↑
Passage The “half of the oxygen” figure describes a flow: the share of annual production that comes from the ocean.
Integrating conceptually similar models of the growth of marine and terrestrial primary producers yielded an estimated global net primary production (NPP) of 104.9 petagrams of carbon per year, with roughly equal contributions from land and oceans.
Source Field, Christopher B., Behrenfeld, Michael J., Randerson, James T. and Falkowski, Paul, “Primary Production of the Biosphere: Integrating Terrestrial and Oceanic Components”, Science, vol. 281, 1998, p. 237-240, abstract.
Paywalled · checked on 25 October 2026
- ↑
Passage Official estimates speak of roughly half, with no exact figure
Scientists estimate that roughly half of the oxygen production on Earth comes from the ocean.
Source National Oceanic and Atmospheric Administration, “How Much Oxygen Comes from the Ocean?”, National Ocean Service, page mise à jour le 23 September 2026, open access, “How much oxygen comes from the ocean?” fact sheet, second paragraph.
Open access open the source · checked on 24 October 2026
Passage the amounts are constantly changing and they are measured by satellite, which does not show everything
Calculating the exact percentage of oxygen produced in the ocean is difficult because the amounts are constantly changing […] but satellite imagery cannot tell the whole story.
Source National Oceanic and Atmospheric Administration, “How Much Oxygen Comes from the Ocean?”, National Ocean Service, page mise à jour le 23 September 2026, open access, “How much oxygen comes from the ocean?” fact sheet.
Open access open the source · checked on 24 October 2026
- ↑
Passage From the stock accumulated over hundreds of millions of years
There is also oxygen in the atmosphere which has accumulated over hundreds of millions of years. As land animals, most of the oxygen humans breathe comes from this source.
Source National Oceanic and Atmospheric Administration, “How Much Oxygen Comes from the Ocean?”, National Ocean Service, page mise à jour le 23 September 2026, open access, “How much oxygen comes from the ocean?” fact sheet.
Open access open the source · checked on 24 October 2026
- ↑
Passage Some store several hundred tonnes of carbon per hectare in their sediments
Four sites fell below the globally documented range of 115.5–829.2 Mg C ha⁻¹ (from 41 100cm cores) […]
Source Green, A., Chadwick, M. A. and Jones, P. J. S., “Variability of UK Seagrass Sediment Carbon: Implications for Blue Carbon Estimates and Marine Conservation Management”, PLoS ONE, vol. 13, no. 9, e0204431, 2018, p. 10, Discussion, “C stock comparisons” subsection.
Open access open the source · checked on 27 October 2026
Passage they accumulate it much faster, area for area, than land forests
Atmospheric carbon is captured by coastal mangroves, seagrasses and salt marshes at a rate five times faster than tropical forests.
Source Reynolds, Pamela L., “Seagrass and Seagrass Beds”, Smithsonian Ocean, National Museum of Natural History, page consulted on 27 October 2026, “Blue Carbon” section, photo caption.
Open access open the source · checked on 27 October 2026
- ↑
Passage The areas actually mapped range from about 160,000 to 600,000 square kilometres […] studies that attempt to estimate the potential extent through modelling […] arrive at values up to ten times higher
Estimates of global seagrass spatial distribution differ greatly throughout the published literature, ranging from 177 000 to 600 000 km2 with models suggesting potential distribution an order of magnitude higher. […] we have estimated with Moderate to High confidence the global seagrass area to date as 160 387 km2
Source McKenzie, Len J. et al., “The Global Distribution of Seagrass Meadows”, Environmental Research Letters, vol. 15, 074041, 2020, abstract, p. 1.
Open access · checked on 24 October 2026
- ↑
Passage more than 2,700 sediment cores
analyses of a comprehensive global database including 2700+ seagrass soil cores
Source Krause, Johannes R. et al., “Global Seagrass Carbon Stock Variability and Emissions from Seagrass Loss”, Nature Communications, vol. 16, 3798, 2025, abstract.
Open access open the source · checked on 9 September 2026
Passage the median value is 24.2 tonnes of carbon per hectare in the top thirty centimetres of soil — that is, 27% less than earlier syntheses
The median global soil Corg stock estimate is 24.2 (12.4 – 44.9) Mg Corg ha−1 in the top 30 cm of soil, 27% lower than estimates from previous global syntheses
Source Krause, Johannes R. et al., “Global Seagrass Carbon Stock Variability and Emissions from Seagrass Loss”, Nature Communications, vol. 16, 3798, 2025, abstract.
Open access open the source · checked on 9 September 2026
- ↑
Passage The first measurements mainly concerned seagrass meadows very rich in carbon; some regions and species had been little studied.
early available data were biased toward seagrass habitats with high soil Corg stocks […] the global scientific community has made considerable effort to generate data for previously understudied regions, seagrass taxa, and environments
Source Krause, Johannes R. et al., “Global Seagrass Carbon Stock Variability and Emissions from Seagrass Loss”, Nature Communications, vol. 16, 3798, 2025, “Results and discussion” (Global seagrass carbon stocks); “Outlook”.
Open access open the source · checked on 9 September 2026
- ↑
Passage Mediterranean seagrass meadows are among the richest in the world: it was mainly they that supplied the very high values
These Corg stock data were skewed high by very large stock estimates (mostly from Mediterranean Posidonia oceanica meadows)
Source Krause, Johannes R. et al., “Global Seagrass Carbon Stock Variability and Emissions from Seagrass Loss”, Nature Communications, vol. 16, 3798, 2025, “Results and discussion”, Global seagrass carbon stocks, 1st paragraph.
Open access open the source · checked on 9 September 2026
- ↑
Passage from 12 to 45 tonnes per hectare […] depending on the plant species and the type of coast
24.2 (12.4 – 44.9) Mg Corg ha−1 […] biogeographical (coastal typology, marine ecoregion) as well as taxonomic (seagrass species, genus, and functional group) predictors were significant
Source Krause, Johannes R. et al., “Global Seagrass Carbon Stock Variability and Emissions from Seagrass Loss”, Nature Communications, vol. 16, 3798, 2025, abstract; “Results and discussion” (Global correlates of seagrass carbon stocks).
Open access open the source · checked on 9 September 2026
- ↑
Passage about 29% of the known area of seagrass meadows has disappeared, and […] the rate of loss has risen from 0.9% to 7% per year
Our comprehensive global assessment of 215 studies found that seagrasses have been disappearing at a rate of 110 km2 yr−1 since 1980 and that 29% of the known areal extent has disappeared since seagrass areas were initially recorded in 1879. Furthermore, rates of decline have accelerated from a median of 0.9% yr−1 before 1940 to 7% yr−1 since 1990.
Source Waycott, Michelle et al., “Accelerating Loss of Seagrasses across the Globe Threatens Coastal Ecosystems”, Proceedings of the National Academy of Sciences, vol. 106, 2009, p. 12377-12381, abstract.
Open access · checked on 24 October 2026
- ↑
Passage recoveries are documented in some regions, including Europe
Since then, loss rates slowed down for most of the species and fast-growing species recovered in some locations, making the net rate of change in seagrass area experience a reversal in the 2000s, while density metrics improved or remained stable in most sites.
Source de los Santos, Carmen B. et al., “Recent Trend Reversal for Declining European Seagrass Meadows”, Nature Communications, vol. 10, 3356, 2019, abstract.
Open access · checked on 24 October 2026
- ↑
Passage to better guide their protection […] the carbon in threatened seagrass meadows represents, if it were released, more than a billion tonnes of carbon dioxide
We estimate that seagrass carbon stocks at risk of degradation could emit 1,154 Tg (665 – 1699) CO2 […] Greater knowledge of the variation in, and drivers of, seagrass Corg stocks is essential to guide the development, integrity, and reliability of climate change policy and financing to support seagrass conservation and restoration.
Source Krause, Johannes R. et al., “Global Seagrass Carbon Stock Variability and Emissions from Seagrass Loss”, Nature Communications, vol. 16, 3798, 2025, abstract; introduction, 2nd paragraph.
Open access open the source · checked on 9 September 2026
- ↑
Passage According to a recent estimate, they cover about two million square kilometres, nearly six times the area of seagrass meadows.
This value compares favourably with recent efforts to assess the global extent of kelp habitat […] which is estimated at 2.03 × 10⁶ km2 (Jayathilake & Costello, 2021) […] the total area of seagrasses (0.35 × 10⁶ km2, Duarte, 2017)
Source Duarte, Carlos M. et al., “Global Estimates of the Extent and Production of Macroalgal Forests”, Global Ecology and Biogeography, vol. 31, no. 7, 2022, p. 1422-1439, section 3.1.3, “Global estimates by habitat type (approach 3)”.
Open access open the source · checked on 27 October 2026
- ↑
Passage can grow by several tens of centimetres a day
In ideal conditions, kelp can grow up to 18 inches per day […]
Source NOAA National Ocean Service, “What is a kelp forest?”, Ocean Facts, page “What is a kelp forest?”, first paragraph of the text.
Open access open the source · checked on 27 October 2026
- ↑
Passage fragments of seaweed that are carried out to the open sea and the deep ocean
We propose two main modes for the transport of macroalgae to the deep ocean and sediments: macroalgal material drifting through submarine canyons, and the sinking of negatively buoyant macroalgal detritus.
Source Krause-Jensen, Dorte and Duarte, Carlos M., “Substantial Role of Macroalgae in Marine Carbon Sequestration”, Nature Geoscience, vol. 9, 2016, p. 737-742, abstract.
Paywalled · checked on 9 September 2026
- ↑
Passage Oxygen accumulates only when carbon escapes decomposition.
And for oxygen to build up in our atmosphere, plant organic matter must be protected from oxidation. […] Continual burial of carbon is needed to keep the atmosphere pumped up with oxygen.
Source Tenenbaum, David, “Fossil fuel formation: Key to atmosphere’s oxygen?”, College of Letters & Science, University of Wisconsin–Madison, 30 December 2016, body of the article, 7th and 19th paragraphs.
Open access open the source · checked on 27 October 2026
- ↑
Passage a brown alga (such as kelp or sargassum) is genetically closer […] a diatom than to a green alga
It may seem hard to believe that microscopic diatoms, with their delicate silica skeletons […] can be related to the giant kelps, which may grow as long as fifty meters, or that either one is related to the downy mildew that nearly destroyed the French wine industry. […] Even though they are photosynthetic, chromists are not at all closely related to plants, or even to other algae.
Source University of California Museum of Paleontology, “Introduction to the Chromista”, page consulted on 27 October 2026, first and second paragraphs.
Open access open the source · checked on 27 October 2026
Passage genetically closer to a potato parasite
Stramenopiles: Diatoms, Brown Algae, Golden Algae and Oomycetes […] Most oomycetes are aquatic, but some parasitize terrestrial plants. One plant pathogen is Phytophthora infestans, the causative agent of late blight of potatoes, such as occurred in the nineteenth century Irish potato famine.
Source Clark, Mary Ann, Douglas, Matthew and Choi, Jung, Biology 2e, OpenStax, 2018, section 23.3 “Groups of Protists”, section 23.3, “Chromalveolata” part, “Stramenopiles: Diatoms, Brown Algae, Golden Algae and Oomycetes” heading, paragraph on oomycetes.
Open access open the source · checked on 27 October 2026
- ↑
Passage The ocean absorbs […] our CO₂ emissions. This alters the chemistry of the water: the pH falls.
Rising atmospheric carbon dioxide (CO2), primarily from human fossil fuel combustion, reduces ocean pH and causes wholesale shifts in seawater carbonate chemistry.
Source Doney, Scott C. et al., “Ocean Acidification: The Other CO₂ Problem”, Annual Review of Marine Science, vol. 1, 2009, p. 169-192, abstract.
Paywalled · checked on 9 September 2026
Passage An underwater heatwave can wipe out the kelp forest along some hundred kilometres of coast
Here we reveal a rapid climate-driven regime shift of Australian temperate reef communities, which lost their defining kelp forests and became dominated by persistent seaweed turfs. After decades of ocean warming, extreme marine heat waves forced a 100-kilometer range contraction of extensive kelp forests
Source Wernberg, Thomas et al., “Climate-driven Regime Shift of a Temperate Marine Ecosystem”, Science, vol. 353, 2016, p. 169-172, abstract (second and third sentences).
Paywalled · checked on 25 October 2026
- ↑
Passage its decomposition consumes a large part of the dissolved oxygen at the bottom of the water […] dead zones
Enhanced primary production results in an accumulation of particulate organic matter, which encourages microbial activity and the consumption of dissolved oxygen in bottom waters.
Source Diaz, Robert J. and Rosenberg, Rutger, “Spreading Dead Zones and Consequences for Marine Ecosystems”, Science, vol. 321, 2008, p. 926-929, abstract.
Paywalled · checked on 25 October 2026
Bibliography
21
- Berner, Robert A., “The Long-term Carbon Cycle, Fossil Fuels and Atmospheric Composition”, Nature, vol. 426, 2003, p. 323-326, paywalled (oxygen accumulated thanks to buried carbon; see entries 6.8 and 6.9).
- Clark, Mary Ann, Douglas, Matthew and Choi, Jung, Biology 2e, OpenStax, 2018, section 23.3 “Groups of Protists”, open access (diatoms, brown algae and oomycetes, including the agent of potato late blight, grouped in the stramenopiles). https://openstax.org/books/biology-2e/pages/23-3-groups-of-protists
- de los Santos, Carmen B. et al., “Recent Trend Reversal for Declining European Seagrass Meadows”, Nature Communications, vol. 10, 3356, 2019, open access (the European recoveries).
- Diaz, Robert J. and Rosenberg, Rutger, “Spreading Dead Zones and Consequences for Marine Ecosystems”, Science, vol. 321, 2008, p. 926-929, paywalled (eutrophication and dead zones).
- Doney, Scott C. et al., “Ocean Acidification: The Other CO₂ Problem”, Annual Review of Marine Science, vol. 1, 2009, p. 169-192, paywalled (acidification and its effects).
- Duarte, Carlos M. et al., “Global Estimates of the Extent and Production of Macroalgal Forests”, Global Ecology and Biogeography, vol. 31, no. 7, 2022, p. 1422-1439, open access (about 2 million km² of kelp habitat, against 0.35 million km² of seagrass). https://doi.org/10.1111/geb.13515
- Field, Christopher B., Behrenfeld, Michael J., Randerson, James T. and Falkowski, Paul, “Primary Production of the Biosphere: Integrating Terrestrial and Oceanic Components”, Science, vol. 281, 1998, p. 237-240, paywalled (the ocean’s share of primary production).
- Fourqurean, James W. et al., “Seagrass Ecosystems as a Globally Significant Carbon Stock”, Nature Geoscience, vol. 5, 2012, p. 505-509, paywalled (seagrass carbon stocks and their rate of accumulation).
- Green, A., Chadwick, M. A. and Jones, P. J. S., “Variability of UK Seagrass Sediment Carbon: Implications for Blue Carbon Estimates and Marine Conservation Management”, PLoS ONE, vol. 13, no. 9, e0204431, 2018, open access (seagrass sediment carbon stocks: a global range of 115.5 to 829.2 tonnes per hectare over one metre). https://doi.org/10.1371/journal.pone.0204431
- Krause, Johannes R. et al., “Global Seagrass Carbon Stock Variability and Emissions from Seagrass Loss”, Nature Communications, vol. 16, 3798, 2025, open access (more than 2,700 cores; a median of 24.2 tonnes of carbon per hectare in the top thirty centimetres, with a range of 12.4 to 44.9; 27% less than earlier syntheses; variability by species and type of coast; Mediterranean seagrass meadows as the source of the very high values; the emissions estimate and its social cost). https://doi.org/10.1038/s41467-025-59204-4
- Krause-Jensen, Dorte and Duarte, Carlos M., “Substantial Role of Macroalgae in Marine Carbon Sequestration”, Nature Geoscience, vol. 9, 2016, p. 737-742, paywalled (the export of fragments to the deep ocean).
- Lecointre, Guillaume and Le Guyader, Hervé, Classification phylogénétique du vivant, 4e éd., Belin, 2016-2017 (2 tomes), in libraries (“alga” is not a group; brown algae, green algae and cyanobacteria).
- McKenzie, Len J. et al., “The Global Distribution of Seagrass Meadows”, Environmental Research Letters, vol. 15, 074041, 2020, open access (area estimates by method, mapping versus modelling).
- National Oceanic and Atmospheric Administration, “How Much Oxygen Comes from the Ocean?”, National Ocean Service, page mise à jour le 23 September 2026, open access (about half of oxygen production, and the consumption of a roughly equal amount by marine life). https://oceanservice.noaa.gov/facts/ocean-oxygen.html
- NOAA National Ocean Service, “What is a kelp forest?”, Ocean Facts, open access (kelp growth of up to 18 inches, about 45 cm, a day in ideal conditions). https://oceanservice.noaa.gov/facts/kelp.html
- Reynolds, Pamela L., “Seagrass and Seagrass Beds”, Smithsonian Ocean, National Museum of Natural History, page consulted on 27 October 2026, open access (mangroves, seagrasses and salt marshes capture carbon five times faster than tropical forests). https://ocean.si.edu/ocean-life/plants-algae/seagrass-and-seagrass-beds
- Tenenbaum, David, “Fossil fuel formation: Key to atmosphere’s oxygen?”, College of Letters & Science, University of Wisconsin–Madison, 30 December 2016, open access (oxygen that builds up only if organic matter escapes oxidation; the continual burial of carbon; see entry 6.9). https://ls.wisc.edu/news/fossil-fuel-formation-key-to-atmospheres-oxygen
- University of California Museum of Paleontology, “Introduction to the Chromista”, page consulted on 27 October 2026, open access (diatoms, kelps and downy mildews related; chromists not closely related to plants or to other algae). https://ucmp.berkeley.edu/chromista/chromista.html
- Waycott, Michelle et al., “Accelerating Loss of Seagrasses across the Globe Threatens Coastal Ecosystems”, Proceedings of the National Academy of Sciences, vol. 106, 2009, p. 12377-12381, open access (about 29% loss since 1879; a rise from 0.9% to 7% per year).
- Wernberg, Thomas et al., “Climate-driven Regime Shift of a Temperate Marine Ecosystem”, Science, vol. 353, 2016, p. 169-172, paywalled (a marine heatwave destroying some hundred kilometres of kelp forest).
- Wernberg, Thomas, Krumhansl, Kira, Filbee-Dexter, Karen and Pedersen, Morten F., “Status and Trends for the World’s Kelp Forests”, dans World Seas: An Environmental Evaluation, Academic Press, 2019, in libraries (the growth of kelp forests).
Spotted an error or have a doubt? Write to us.