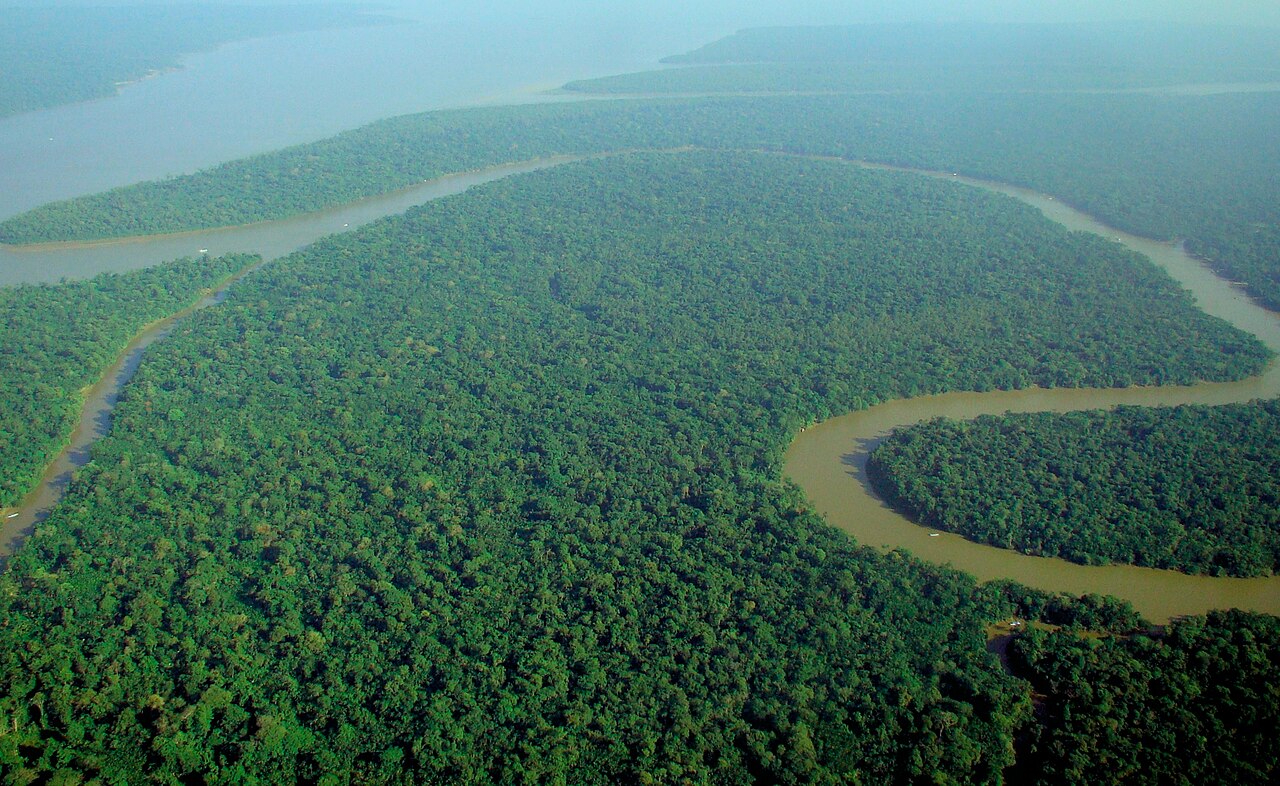

No, the Amazon does not produce twenty per cent of the planet’s oxygen: three words were lost along the way.
Where the figure comes from
The original figure was correct. In its full form, it reads as follows:
the Amazon supplies around twenty per cent of the oxygen produced by photosynthesis on dry land.1
On dry land: three words.
Without them, the sentence becomes: twenty per cent of the oxygen, full stop. The oxygen of the entire atmosphere.
It is not a lie, and nobody rigged anything. It is a detail that got lost along the way, as thousands get lost every day, and the figure went on travelling without it.
This site describes elsewhere the case of a figure on biodiversity that lost its source along the way and has been circulating since 2009. It is exactly the same mechanism.
The corrected figure
If the ocean is included, what do the calculations give?
Nine per cent, according to Yadvinder Malhi, an Oxford ecologist who specialises in the Amazon. Six per cent, according to the climate scientist Jonathan Foley.2
A third observes that the two values are equivalent within the uncertainty of the calculation — in other words, they do not really contradict each other.3
So this is where we stand: between six and nine per cent, instead of twenty.
But that is still not the main point.
The fact that changes everything
Trees produce oxygen. They also consume it.
They respire — especially at night, when photosynthesis stops. What they do not use is consumed by the countless micro-organisms that break down dead leaves and fallen wood.
The arithmetic is quick.
The Amazon’s net balance is close to zero.4
The details are known: Amazonian plants themselves consume a little over half of the oxygen they produce, and the micro-organisms that break down dead matter take care of the rest.5
The researcher who made this calculation adds a striking remark: this holds for the Amazon or for any other biome — and he specifies the timescale, which matters. Over the periods that concern us, that is, less than a few million years, the balance of any ecosystem is close to zero. A forest in equilibrium does not fill the atmosphere with oxygen: it produces it and consumes it, in roughly equal measure.6
This point should be kept in mind, because the next section depends entirely on it.
So where does the oxygen we breathe come from?
From photosynthesis, yes — but from a very ancient photosynthesis.
From organisms that died hundreds of millions of years ago, whose matter never rotted and ended up buried under sediments.
This is the key: oxygen builds up in the atmosphere when carbon escapes decomposition.7
If everything that grows eventually decomposes, all the oxygen produced is consumed again, and the account returns to zero. Part of it has to be removed from the cycle — buried, compressed, forgotten — for the balance to rise.
The air we breathe is therefore a geological legacy, not current production.
Why there are more species towards the equator
The number of species increases steadily from the poles towards the equator. This holds for trees, birds, insects, and almost every group.
Specialists call this the latitudinal diversity gradient, and a synthesis of nearly six hundred cases has confirmed that it holds very generally.8
Nobody knows why.
This is no exaggeration
The reference synthesis, published by some twenty researchers in 2007, opens by noting that how and why this gradient arose remains unresolved. A 2019 review says it again in the same terms: it is one of the most widely studied patterns in all of ecology, and no consensus has been reached about its causes. The disagreement concerns the relative importance of the processes involved, not the existence of the pattern.9
The what is solid. The why is not.
This pattern has been measured for a century and a half, and we still do not know what produces it.
Six explanations, no winner
They are all plausible, and none has been ruled out, even if some researchers are betting mainly on time and area.10
- More time — the tropics are geologically older and have had more time to diversify.
- More area — tropical environments covered vast expanses for fifty-five million years. A study of more than 12,500 species of woody plants supports this idea: transitions between tropical and temperate environments are rare, and most temperate lineages arose after the global cooling that began 34 million years ago.
- More mutations — higher temperature, faster metabolism.
- More niches — more ways of making a living.
- More specialised enemies — herbivores and diseases would prevent any one species from dominating.
- An ecological limit that would set a ceiling on the number of species a place can support.11
Testing the fifth, and what it showed
Researchers set out to check the specialised-enemies hypothesis. The idea to be tested: the more numerous a tree species is in one place, the more its enemies settle there, and the harder it is for its young shoots to survive — which leaves room for the others.
The scale of the work is worth stressing: more than three thousand species, nearly two million four hundred thousand trees, in twenty-four plots spread across the globe.12
Result: this effect is stronger in the tropics than in temperate latitudes.13
But the most interesting result lies elsewhere. It is not only the intensity that changes with latitude — it is also the species it strikes. In the tropics, the effect strikes rare species more than in temperate forests.14
If this is confirmed, the consequence is elegant: rare species there would be protected by their own rarity, which would allow them to persist instead of disappearing. A mechanism that, rather than eliminating the weak, prevents the strong from taking everything.15
The challenge, a year later
Another team replied that this result may have arisen from a methodological artefact — that is, from an effect produced by the method of calculation, not by nature. It adds that several different processes can explain the same observed pattern.16
The original authors replied in the same issue.
What is at stake here deserves attention. This is not a hypothesis that is proved and then put away: it is a hypothesis that is tested, whose test is challenged, and whose discussion continues. This is the normal state of a live question, and that is why none of the six explanations has won yet.
And the figures are themselves ranges
Among insects, there are about 1 million named species. For all terrestrial arthropods — insects, spiders and their relatives — the total is estimated at 7 million; older estimates went as high as 30 million, a figure now considered very unlikely.17
Researchers have narrowed the range, but it remains wide: the number of species on Earth is known only approximately.
To end with a concrete example: on a study plot on Barro Colorado Island, in Panama, the first census, completed in 1982, counted approximately 240,000 stems belonging to 303 species of trees and shrubs more than 1 cm in diameter at breast height.18
The measurement trap: counting felled trees
Of all the questions concerning tropical forests, deforestation is probably the one that generates the most contradictory figures.
This is not because researchers lie. It is because they are not measuring the same thing.
The definition that changes everything
What is a “forest”? The answer varies according to the institution giving it.
- The FAO (Food and Agriculture Organization of the United Nations) defines a forest as an area of more than 0.5 hectares with trees more than 5 metres tall and a tree canopy cover of more than 10%.
- Some governments set the cover threshold at 30%, others at 70%.
- Satellite data measure the loss of tree cover, which covers a clear-cut in primary forest just as much as the harvest of an oil palm or eucalyptus plantation.19
Result: an area clear-felled and then replanted as a monoculture of fast-growing trees can be counted as a restored forest under some criteria, even though it has lost most of its biodiversity.
Outdated historical data
For decades, assessment relied solely on reports submitted by states, which were often imprecise or politically slanted. The arrival of freely available satellite imagery (such as the Landsat programme) transformed measurement from the 2000s onwards.
But historical comparisons remain tricky: comparing a 1990 figure calculated from administrative reports with a 2026 figure established by high-resolution satellite observation amounts to comparing two different quantities.
As with the oxygen figure, the complexity lies in the definitions. Before debating whether a figure has gone down or up, one must ask: what exactly was counted?
An inversion to avoid
This page has just shown that the Amazon does not produce the oxygen attributed to it.
It should not be concluded that it is unimportant.
This is exactly the misreading this site tries to help avoid, and we come across it everywhere. Correcting an exaggerated figure does not mean the subject was of no interest. It means that that was not the right reason.
We make the same point in our page on the great centres of learning, where correcting a legend in no way diminishes what really happened.
Checking means replacing a bad reason with a good one. It does not mean taking the reason away.
Note 1
Malhi and Coe reckon it stems from the fact that the Amazon contributes around 20 percent of the oxygen produced by photosynthesis on land—which may have erroneously slipped into public knowledge as “20 percent of the oxygen in the atmosphere.”
Zimmer, Katarina, “Why the Amazon Doesn’t Really Produce 20 % of the World’s Oxygen”, National Geographic, 28 August 2019
Note 2
That would mean the Amazon generates around 16 percent of oxygen produced on land, explains Malhi. That percentage sinks to 9 percent when taking into account the oxygen produced by phytoplankton in the ocean. […] Climate scientist Jonathan Foley, who directs the nonprofit Project Drawdown which researches climate change solutions, arrived at a more conservative estimate of 6 percent
Zimmer, Katarina, “Why the Amazon Doesn’t Really Produce 20 % of the World’s Oxygen”, National Geographic, 28 August 2019
Note 3
Across the pond, Yadvinder Malhi, an ecologist at the University of Oxford who specializes in the Amazon rainforest, came up with 9%. Bonan said that both numbers are essentially the same and are “within the ballpark of uncertainty” for the calculation.
McDonald, Jessica, “Amazon Doesn’t Produce 20% of Earth’s Oxygen”, FactCheck.org, 3 September 2019
Note 4
The Amazon’s net contribution to the oxygen we breathe likely hovers around zero. […] “The net [oxygen] effect of the Amazon, or really any other biome, is around zero,” he explains.
Zimmer, Katarina, “Why the Amazon Doesn’t Really Produce 20 % of the World’s Oxygen”, National Geographic, 28 August 2019
Note 5
Malhi’s research team reckons that trees inhale a little over half the oxygen they produce this way. The rest is probably used up by the countless microbes that live in the Amazon, which inhale oxygen to break down dead organic matter of the forest.
Zimmer, Katarina, “Why the Amazon Doesn’t Really Produce 20 % of the World’s Oxygen”, National Geographic, 28 August 2019
Note 6
"The net [oxygen] effect of the Amazon, or really any other biome, is around zero," he explains.
Zimmer, Katarina, “Why the Amazon Doesn’t Really Produce 20 % of the World’s Oxygen”, National Geographic, 28 August 2019
the net contribution of the Amazon ECOSYSTEM (not just the plants alone) to the world's oxygen is effectively zero. The same is pretty much true of any ecosystem on Earth, at least on the timescales that are relevant to humans (less than millions of years).
Malhi, Yadvinder, billet de blog sur la part de l’Amazonie dans l’oxygène du monde, site personnel de l’auteur (université d’Oxford), August 2019
Note 7
The effect of the carbon and sulfur cycles on atmospheric oxygen can be succinctly summarized in terms of reactions involving organic matter and pyrite. […] Here reaction 1, going from left to right, represents net long-term photosynthesis (photosynthesis minus respiration) manifested by the burial of organic matter in sediments. […] The modeling shows that increased oxygen production (reaction 1) caused by increased burial of organic carbon was the chief suspect.
Berner, Robert A., “Atmospheric Oxygen over Phanerozoic Time”, Proceedings of the National Academy of Sciences, vol. 96, no. 20, 1999, p. 10955-10957
Note 8
The decline of biodiversity with latitude has received great attention, but both the concise pattern and the causes of the gradient are under strong debate. […] To test for significant variation in the gradient between organisms, habitats, or regions, a meta‐analysis was conducted on nearly 600 latitudinal gradients assembled from the literature. […] The analysis corroborated the high generality of the latitudinal diversity decline.
Hillebrand, Helmut, “On the Generality of the Latitudinal Diversity Gradient”, The American Naturalist, vol. 163, 2004, p. 192-211
Note 9
A latitudinal gradient in biodiversity has existed since before the time of the dinosaurs, yet how and why this gradient arose remains unresolved.
Mittelbach, Gary G. et al., “Evolution and the Latitudinal Diversity Gradient: Speciation, Extinction and Biogeography”, Ecology Letters, vol. 10, 2007, p. 315-331
The latitudinal diversity gradient (LDG) is one of the most widely studied patterns in ecology, yet no consensus has been reached about its underlying causes.
Pontarp, Mikael et al., “The Latitudinal Diversity Gradient: Novel Understanding through Mechanistic Eco-evolutionary Models”, Trends in Ecology & Evolution, vol. 34, no. 3, 2019, p. 211-223
Note 10
Instead, climate stability and time–integrated area together determine the baselines of both terrestrial and marine global diversity patterns.
Fine, Paul V. A., “Ecological and Evolutionary Drivers of Geographic Variation in Species Diversity”, Annual Review of Ecology, Evolution, and Systematics, vol. 46, 2015, p. 369-392
Note 11
Here, we use geographic and evolutionary data for over 12,500 species of woody flowering plants to test the "tropical conservatism hypothesis," […] As predicted, we find that transitions between tropical and temperate environments are quite rare over the evolutionary history and that most temperate lineages originated as Earth cooled over the past 34 My.
Kerkhoff, Andrew J., Moriarty, Pamela E. and Weiser, Michael D., “The Latitudinal Species Richness Gradient in New World Woody Angiosperms Is Consistent with the Tropical Conservatism Hypothesis”, Proceedings of the National Academy of Sciences, vol. 111, 2014, p. 8125-8130
Note 12
By using more than 3000 species and nearly 2.4 million trees across 24 forest plots worldwide
LaManna, Joseph A. et al., “Plant Diversity Increases with the Strength of Negative Density Dependence at the Global Scale”, Science, vol. 356, 2017, p. 1389-1392
Note 13
global patterns in tree species diversity reflect not only stronger CNDD at tropical versus temperate latitudes
LaManna, Joseph A. et al., “Plant Diversity Increases with the Strength of Negative Density Dependence at the Global Scale”, Science, vol. 356, 2017, p. 1389-1392
Note 14
global patterns in tree species diversity reflect not only stronger CNDD at tropical versus temperate latitudes but also a latitudinal shift in the relationship between CNDD and species abundance. CNDD was stronger for rare species at tropical versus temperate latitudes
LaManna, Joseph A. et al., “Plant Diversity Increases with the Strength of Negative Density Dependence at the Global Scale”, Science, vol. 356, 2017, p. 1389-1392
Note 15
potentially causing the persistence of greater numbers of rare species in the tropics
LaManna, Joseph A. et al., “Plant Diversity Increases with the Strength of Negative Density Dependence at the Global Scale”, Science, vol. 356, 2017, p. 1389-1392
Note 16
We show that the CNDD-abundance correlation may have arisen from a methodological artifact and that a range of processes can explain the reported latitudinal pattern.
Hülsmann, Lisa and Hartig, Florian, “Comment on "Plant Diversity Increases with the Strength of Negative Density Dependence at the Global Scale"”, Science, vol. 360, eaar2435, 2018
Note 17
Taking the mean of most of these new estimates indicates that globally there are approximately 1.5 million, 5.5 million, and 7 million species of beetles, insects, and terrestrial arthropods, respectively. Previous estimates of 30 million species or more based on the host specificity of insects to plants now seem extremely unlikely. With 1 million insect species named, this suggests that 80% remain to be discovered
Stork, Nigel E., “How Many Species of Insects and Other Terrestrial Arthropods Are There on Earth?”, Annual Review of Entomology, vol. 63, 2018, p. 31-45
Note 18
The first census was completed in 1982, revealing a total of approximately 240,000 stems of 303 species of trees and shrubs more than 1 cm in diameter at breast height.
ForestGEO, Smithsonian Institution, “Barro Colorado Island”, study site description
Note 19
Land spanning more than 0.5 hectares with trees higher than 5 meters and a canopy cover of more than 10 percent, or trees able to reach these thresholds in situ.
FAO, Global Forest Resources Assessment: Terms and Definitions, Rome
Satellites can’t easily distinguish between primary and secondary forests, which occur naturally, and planted forests, which are created and managed by people to supply timber, rubber and other commodities. […] Much of the annual tree cover loss in Indonesia and Malaysia, visualized in pink above, is likely the harvesting of trees that were planted as of 2000—the farthest back data on Global Forest Watch goes—and not old-growth or natural forests.
Petersen, Rachael, Goldman, Elizabeth, Weisse, Mikaela and Aksenov, Dmitry, “Forest Loss Pushes Far Beyond Plantation Boundaries in South America, Africa”
Notes and sources
- ↑
Passage the Amazon supplies around twenty per cent of the oxygen produced by photosynthesis on dry land
Malhi and Coe reckon it stems from the fact that the Amazon contributes around 20 percent of the oxygen produced by photosynthesis on land—which may have erroneously slipped into public knowledge as “20 percent of the oxygen in the atmosphere.”
Source Zimmer, Katarina, “Why the Amazon Doesn’t Really Produce 20 % of the World’s Oxygen”, National Geographic, 28 August 2019, body of the article, passage on the origin of the figure.
Open access open the source · checked on 24 October 2026
- ↑
Passage Nine per cent, according to Yadvinder Malhi […] Six per cent, according to the climate scientist Jonathan Foley
That would mean the Amazon generates around 16 percent of oxygen produced on land, explains Malhi. That percentage sinks to 9 percent when taking into account the oxygen produced by phytoplankton in the ocean. […] Climate scientist Jonathan Foley, who directs the nonprofit Project Drawdown which researches climate change solutions, arrived at a more conservative estimate of 6 percent
Source Zimmer, Katarina, “Why the Amazon Doesn’t Really Produce 20 % of the World’s Oxygen”, National Geographic, 28 August 2019, body of the article, passage on the estimates.
Open access open the source · checked on 24 October 2026
- ↑
Passage the two values are equivalent within the uncertainty of the calculation
Across the pond, Yadvinder Malhi, an ecologist at the University of Oxford who specializes in the Amazon rainforest, came up with 9%. Bonan said that both numbers are essentially the same and are “within the ballpark of uncertainty” for the calculation.
Source McDonald, Jessica, “Amazon Doesn’t Produce 20% of Earth’s Oxygen”, FactCheck.org, 3 September 2019, section « A Better Estimate ».
Open access open the source · checked on 24 October 2026
- ↑
Passage The Amazon’s net balance is close to zero.
The Amazon’s net contribution to the oxygen we breathe likely hovers around zero. […] “The net [oxygen] effect of the Amazon, or really any other biome, is around zero,” he explains.
Source Zimmer, Katarina, “Why the Amazon Doesn’t Really Produce 20 % of the World’s Oxygen”, National Geographic, 28 August 2019, body of the article, passage on the net balance (remarks by Yadvinder Malhi).
Open access open the source · checked on 24 October 2026
- ↑
Passage Amazonian plants themselves consume a little over half of the oxygen they produce, and the micro-organisms […] the rest
Malhi’s research team reckons that trees inhale a little over half the oxygen they produce this way. The rest is probably used up by the countless microbes that live in the Amazon, which inhale oxygen to break down dead organic matter of the forest.
Source Zimmer, Katarina, “Why the Amazon Doesn’t Really Produce 20 % of the World’s Oxygen”, National Geographic, 28 August 2019, body of the article, passage on respiration.
Open access open the source · checked on 24 October 2026
- ↑
Passage this holds for the Amazon or for any other biome
"The net [oxygen] effect of the Amazon, or really any other biome, is around zero," he explains.
Source Zimmer, Katarina, “Why the Amazon Doesn’t Really Produce 20 % of the World’s Oxygen”, National Geographic, 28 August 2019, article, remarks by Yadvinder Malhi.
Open access open the source · checked on 25 October 2026
Passage Over the periods that concern us, that is, less than a few million years, the balance of any ecosystem is close to zero.
the net contribution of the Amazon ECOSYSTEM (not just the plants alone) to the world's oxygen is effectively zero. The same is pretty much true of any ecosystem on Earth, at least on the timescales that are relevant to humans (less than millions of years).
Source Malhi, Yadvinder, billet de blog sur la part de l’Amazonie dans l’oxygène du monde, site personnel de l’auteur (université d’Oxford), August 2019, August 2019 post, explanation of the net balance.
Open access open the source · checked on 25 October 2026
- ↑
Passage oxygen builds up in the atmosphere when carbon escapes decomposition
The effect of the carbon and sulfur cycles on atmospheric oxygen can be succinctly summarized in terms of reactions involving organic matter and pyrite. […] Here reaction 1, going from left to right, represents net long-term photosynthesis (photosynthesis minus respiration) manifested by the burial of organic matter in sediments. […] The modeling shows that increased oxygen production (reaction 1) caused by increased burial of organic carbon was the chief suspect.
Source Berner, Robert A., “Atmospheric Oxygen over Phanerozoic Time”, Proceedings of the National Academy of Sciences, vol. 96, no. 20, 1999, p. 10955-10957, sections « The Geological Carbon and Sulfur Cycles » and « Oxygen and the Rise of Vascular Land Plants ».
Open access open the source · checked on 9 September 2026
- ↑
Passage latitudinal diversity gradient […] a synthesis of nearly six hundred cases has confirmed that it holds very generally
The decline of biodiversity with latitude has received great attention, but both the concise pattern and the causes of the gradient are under strong debate. […] To test for significant variation in the gradient between organisms, habitats, or regions, a meta‐analysis was conducted on nearly 600 latitudinal gradients assembled from the literature. […] The analysis corroborated the high generality of the latitudinal diversity decline.
Source Hillebrand, Helmut, “On the Generality of the Latitudinal Diversity Gradient”, The American Naturalist, vol. 163, 2004, p. 192-211, abstract.
Paywalled · checked on 9 September 2026
- ↑
Passage how and why this gradient arose remains unresolved
A latitudinal gradient in biodiversity has existed since before the time of the dinosaurs, yet how and why this gradient arose remains unresolved.
Source Mittelbach, Gary G. et al., “Evolution and the Latitudinal Diversity Gradient: Speciation, Extinction and Biogeography”, Ecology Letters, vol. 10, 2007, p. 315-331, abstract, first sentence.
Open access open the source · checked on 24 October 2026
Passage it is one of the most widely studied patterns in all of ecology, and no consensus has been reached about its causes
The latitudinal diversity gradient (LDG) is one of the most widely studied patterns in ecology, yet no consensus has been reached about its underlying causes.
Source Pontarp, Mikael et al., “The Latitudinal Diversity Gradient: Novel Understanding through Mechanistic Eco-evolutionary Models”, Trends in Ecology & Evolution, vol. 34, no. 3, 2019, p. 211-223, abstract (first sentence).
Paywalled · checked on 25 October 2026
- ↑
Passage […] some researchers are betting mainly on time and area.
Instead, climate stability and time–integrated area together determine the baselines of both terrestrial and marine global diversity patterns.
Source Fine, Paul V. A., “Ecological and Evolutionary Drivers of Geographic Variation in Species Diversity”, Annual Review of Ecology, Evolution, and Systematics, vol. 46, 2015, p. 369-392, abstract (penultimate sentence).
Paywalled · checked on 25 October 2026
- ↑
Passage A study of more than 12,500 species of woody plants […] most temperate lineages arose after the global cooling that began 34 million years ago
Here, we use geographic and evolutionary data for over 12,500 species of woody flowering plants to test the "tropical conservatism hypothesis," […] As predicted, we find that transitions between tropical and temperate environments are quite rare over the evolutionary history and that most temperate lineages originated as Earth cooled over the past 34 My.
Source Kerkhoff, Andrew J., Moriarty, Pamela E. and Weiser, Michael D., “The Latitudinal Species Richness Gradient in New World Woody Angiosperms Is Consistent with the Tropical Conservatism Hypothesis”, Proceedings of the National Academy of Sciences, vol. 111, 2014, p. 8125-8130, abstract (« Significance » statement supplied by the publisher).
Open access · checked on 24 October 2026
- ↑
Passage more than three thousand species, nearly two million four hundred thousand trees, in twenty-four plots spread across the globe
By using more than 3000 species and nearly 2.4 million trees across 24 forest plots worldwide
Source LaManna, Joseph A. et al., “Plant Diversity Increases with the Strength of Negative Density Dependence at the Global Scale”, Science, vol. 356, 2017, p. 1389-1392, abstract.
Paywalled open the source · checked on 9 September 2026
- ↑
Passage this effect is stronger in the tropics than in temperate latitudes
global patterns in tree species diversity reflect not only stronger CNDD at tropical versus temperate latitudes
Source LaManna, Joseph A. et al., “Plant Diversity Increases with the Strength of Negative Density Dependence at the Global Scale”, Science, vol. 356, 2017, p. 1389-1392, abstract.
Paywalled open the source · checked on 9 September 2026
- ↑
Passage In the tropics, the effect strikes rare species more than in temperate forests.
global patterns in tree species diversity reflect not only stronger CNDD at tropical versus temperate latitudes but also a latitudinal shift in the relationship between CNDD and species abundance. CNDD was stronger for rare species at tropical versus temperate latitudes
Source LaManna, Joseph A. et al., “Plant Diversity Increases with the Strength of Negative Density Dependence at the Global Scale”, Science, vol. 356, 2017, p. 1389-1392, abstract.
Paywalled open the source · checked on 9 September 2026
- ↑
Passage rare species there would be protected by their own rarity, which would allow them to persist
potentially causing the persistence of greater numbers of rare species in the tropics
Source LaManna, Joseph A. et al., “Plant Diversity Increases with the Strength of Negative Density Dependence at the Global Scale”, Science, vol. 356, 2017, p. 1389-1392, abstract.
Paywalled open the source · checked on 9 September 2026
- ↑
Passage this result may have arisen from a methodological artefact […] several different processes can explain the same observed pattern
We show that the CNDD-abundance correlation may have arisen from a methodological artifact and that a range of processes can explain the reported latitudinal pattern.
Source Hülsmann, Lisa and Hartig, Florian, “Comment on "Plant Diversity Increases with the Strength of Negative Density Dependence at the Global Scale"”, Science, vol. 360, eaar2435, 2018, abstract of the comment.
Paywalled open the source · checked on 9 September 2026
- ↑
Passage Among insects, there are about 1 million named species. For all terrestrial arthropods […] the total is estimated at 7 million; older estimates went as high as 30 million, a figure now considered very unlikely
Taking the mean of most of these new estimates indicates that globally there are approximately 1.5 million, 5.5 million, and 7 million species of beetles, insects, and terrestrial arthropods, respectively. Previous estimates of 30 million species or more based on the host specificity of insects to plants now seem extremely unlikely. With 1 million insect species named, this suggests that 80% remain to be discovered
Source Stork, Nigel E., “How Many Species of Insects and Other Terrestrial Arthropods Are There on Earth?”, Annual Review of Entomology, vol. 63, 2018, p. 31-45, abstract.
Paywalled · checked on 25 October 2026
- ↑
Passage on a study plot on Barro Colorado Island, in Panama, the first census, completed in 1982, counted approximately 240,000 stems belonging to 303 species of trees and shrubs more than 1 cm in diameter at breast height.
The first census was completed in 1982, revealing a total of approximately 240,000 stems of 303 species of trees and shrubs more than 1 cm in diameter at breast height.
Source ForestGEO, Smithsonian Institution, “Barro Colorado Island”, study site description, section “Barro Colorado Island”.
Open access open the source · checked on 27 October 2026
- ↑
Passage an area of more than 0.5 hectares with trees more than 5 metres tall and a tree canopy cover of more than 10%
Land spanning more than 0.5 hectares with trees higher than 5 meters and a canopy cover of more than 10 percent, or trees able to reach these thresholds in situ.
Source FAO, Global Forest Resources Assessment: Terms and Definitions, Rome, definition 1a « Forest » (Terms and definitions, FRA 2020).
Open access open the source · checked on 24 October 2026
Passage Satellite data measure the loss of tree cover, which covers a clear-cut in primary forest just as much as the harvest of an oil palm or eucalyptus plantation
Satellites can’t easily distinguish between primary and secondary forests, which occur naturally, and planted forests, which are created and managed by people to supply timber, rubber and other commodities. […] Much of the annual tree cover loss in Indonesia and Malaysia, visualized in pink above, is likely the harvesting of trees that were planted as of 2000—the farthest back data on Global Forest Watch goes—and not old-growth or natural forests.
Source Petersen, Rachael, Goldman, Elizabeth, Weisse, Mikaela and Aksenov, Dmitry, “Forest Loss Pushes Far Beyond Plantation Boundaries in South America, Africa”, text and caption of the Indonesia–Malaysia map.
Open access open the source · checked on 9 September 2026
Bibliography
18
- Berner, Robert A., “Atmospheric Oxygen over Phanerozoic Time”, Proceedings of the National Academy of Sciences, vol. 96, no. 20, 1999, p. 10955-10957, open access (oxygen produced when organic matter is buried in sediments instead of decomposing). https://pmc.ncbi.nlm.nih.gov/articles/PMC34224
- Berner, Robert A., “The Long-term Carbon Cycle, Fossil Fuels and Atmospheric Composition”, Nature, vol. 426, 2003, p. 323-326, paywalled.
- Condit, Richard et al., “Beta-Diversity in Tropical Forest Trees”, Science, vol. 295, 2002, p. 666-669, paywalled (the Barro Colorado plot, Panama: a tree’s neighbourhood).
- FAO, Global Forest Resources Assessment: Terms and Definitions, Rome, open access (0.5 hectares, 5 metres, 10% cover; see Entry 6.4).
- Fine, Paul V. A., “Ecological and Evolutionary Drivers of Geographic Variation in Species Diversity”, Annual Review of Ecology, Evolution, and Systematics, vol. 46, 2015, p. 369-392, paywalled (the competing hypotheses).
- ForestGEO, Smithsonian Institution, “Barro Colorado Island”, study site description, open access (the first census of the plot, completed in 1982: about 240,000 stems, 303 species of trees and shrubs). https://forestgeo.si.edu/sites/neotropics/barro-colorado-island
- Hansen, Matthew C. et al., “High-Resolution Global Maps of 21st-Century Forest Cover Change”, Science, vol. 342, 2013, p. 850-853, paywalled ; et Global Forest Watch, World Resources Institute, notes méthodologiques, open access. https://globalnaturewatch.org/
- Hillebrand, Helmut, “On the Generality of the Latitudinal Diversity Gradient”, The American Naturalist, vol. 163, 2004, p. 192-211, paywalled (the synthesis of nearly six hundred cases confirming the generality of the gradient).
- Hülsmann, Lisa and Hartig, Florian, “Comment on "Plant Diversity Increases with the Strength of Negative Density Dependence at the Global Scale"”, Science, vol. 360, eaar2435, 2018, paywalled (the possible methodological artefact and the competing processes) ; et LaManna, Joseph A. et al., réponse, ibid., eaar3824, paywalled. https://doi.org/10.1126/science.aar2435
- Kerkhoff, Andrew J., Moriarty, Pamela E. and Weiser, Michael D., “The Latitudinal Species Richness Gradient in New World Woody Angiosperms Is Consistent with the Tropical Conservatism Hypothesis”, Proceedings of the National Academy of Sciences, vol. 111, 2014, p. 8125-8130, open access (more than 12,500 woody species; temperate lineages arising since the cooling of 34 million years ago).
- LaManna, Joseph A. et al., “Plant Diversity Increases with the Strength of Negative Density Dependence at the Global Scale”, Science, vol. 356, 2017, p. 1389-1392, paywalled (more than 3,000 species and nearly 2.4 million trees in 24 plots; the effect stronger in the tropics; the shift of this effect towards rare species and the persistence that would follow from it). https://doi.org/10.1126/science.aam5678
- Malhi, Yadvinder, billet de blog sur la part de l’Amazonie dans l’oxygène du monde, site personnel de l’auteur (université d’Oxford), August 2019, open access (the clarification by the author of the calculation: the Amazon’s photosynthesis accounts for about 9% of that on land, but the ecosystem’s net oxygen balance is practically nil, as for any ecosystem over periods of less than a few million years; post with no displayed title, comments from 24 August 2019 onwards; accessed 25 October 2026). http://www.yadvindermalhi.org/blog/does-the-amazon-provide-20-of-our-oxygen
- McDonald, Jessica, “Amazon Doesn’t Produce 20% of Earth’s Oxygen”, FactCheck.org, 3 September 2019, open access (the detailed calculation, the ocean’s share, the role of carbon burial). https://www.factcheck.org/2019/09/amazon-doesnt-produce-20-of-earths-oxygen/
- Mittelbach, Gary G. et al., “Evolution and the Latitudinal Diversity Gradient: Speciation, Extinction and Biogeography”, Ecology Letters, vol. 10, 2007, p. 315-331, open access (the competing hypotheses and the lack of consensus).
- Petersen, Rachael, Goldman, Elizabeth, Weisse, Mikaela and Aksenov, Dmitry, “Forest Loss Pushes Far Beyond Plantation Boundaries in South America, Africa”, World Resources Institute, 26 January 2016, open access (satellites struggle to distinguish natural forests from plantations; part of the measured tree cover loss is the harvesting of planted trees). https://www.wri.org/insights/forest-loss-pushes-far-beyond-plantation-boundaries-south-america-africa
- Pontarp, Mikael et al., “The Latitudinal Diversity Gradient: Novel Understanding through Mechanistic Eco-evolutionary Models”, Trends in Ecology & Evolution, vol. 34, no. 3, 2019, p. 211-223, paywalled (the lack of consensus on the causes; the difficulty of deciding between hypotheses that are all compatible with the same observations).
- Stork, Nigel E., “How Many Species of Insects and Other Terrestrial Arthropods Are There on Earth?”, Annual Review of Entomology, vol. 63, 2018, p. 31-45, paywalled (described species and the competing estimates).
- Zimmer, Katarina, “Why the Amazon Doesn’t Really Produce 20 % of the World’s Oxygen”, National Geographic, 28 August 2019, open access (the origin of the phrase, the interviews with Yadvinder Malhi and Michael Coe, the net balance close to zero). https://www.nationalgeographic.com/environment/article/why-amazon-doesnt-produce-20-percent-worlds-oxygen
Spotted an error or have a doubt? Write to us.