
A man wanted to reassure the public. He compared his measurements for the year with those from twenty years earlier, expecting them to be identical.
They were not.
That is how the hole in the ozone layer was discovered.
The station
At Halley, in Antarctica, the amount of ozone above the station has been measured since 1956.1
Nobody was looking for anything in particular. It was a matter of monitoring: reading, recording, filing. Year after year, with a ground-based instrument.2
This kind of work is regarded as boring. Yet what it produced is worth remembering.
How it began, in his own words
Jon Shanklin himself recounts the starting point.
An open day was approaching, at which members of the public would come and ask questions. At the time, there was a great deal of concern about aerosols and supersonic aircraft, which were suspected of damaging the ozone layer.
So he took the year’s readings and compared them with those from twenty years earlier, expecting to find them identical — so that he could tell visitors there was no cause for concern.3
They were not identical.
So he went back through the whole backlog of data, to check whether that year was an exception.
It was not.
The real thickness: the skin of an apple?
This comparison is very often made: “If the Earth were an apple, the atmosphere would be as thick as its skin.”
Before using a vivid metaphor, one must check that the ratio is accurate.
- The Earth’s mean radius is about 6,371 kilometres.
- 99% of the total mass of the air is concentrated in the first 30 kilometres.
- This dense core represents 0.47% of the Earth’s radius.
For a standard apple 7.5 centimetres in diameter (37.5 millimetres in radius), 0.47% corresponds to a film 0.17 millimetre thick. That is exactly the average thickness of the peel.
The metaphor is scientifically accurate, provided one is talking about the breathable mass and not the tenuous traces of air that extend up to several thousand kilometres into the exosphere.
The architecture of the sky: the layers of the atmosphere
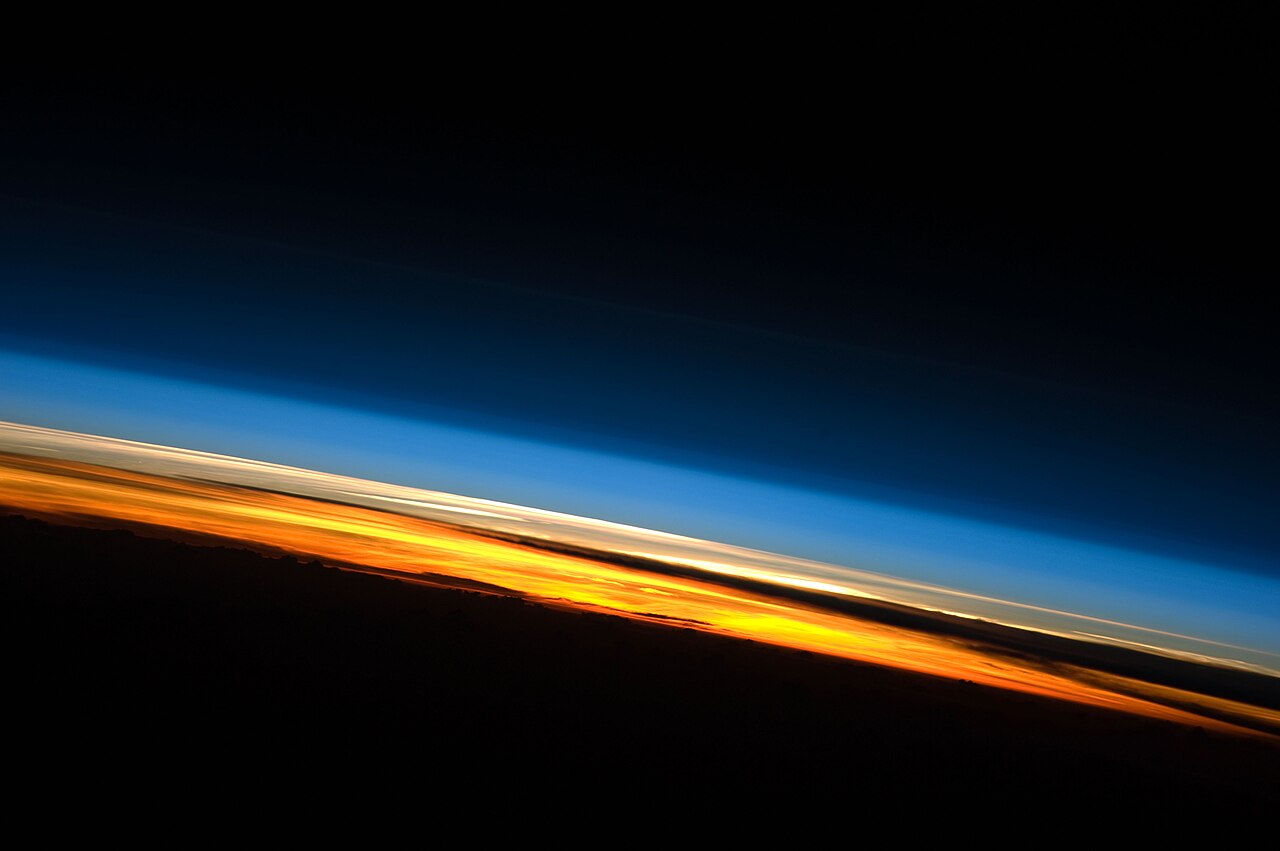
The atmosphere is not a homogeneous block. It is structured in superimposed layers, defined mainly by the variations in its temperature as one goes higher.
- Troposphere (from 0 to 8–15 km) — This is the layer in which we live. It contains about 80% of the total mass of the air and almost all the water vapour. The temperature falls with altitude (down to −55 °C). This is where all weather phenomena take place (clouds, rain, storms).
- Stratosphere (from 12–15 to 50 km) — Here the trend reverses: the temperature rises again to about 0 °C. Why? Because the ozone layer is located there (between 15 and 35 km) and absorbs the Sun’s ultraviolet rays, converting this energy into heat.
- Mesosphere (from 50 to 85 km) — The temperature plunges again, reaching the coldest places on our planet (down to −90 °C). This is the layer in which most meteors disintegrate, forming “shooting stars”.
- Thermosphere (from 85 to 600 km) — The temperature soars here (sometimes exceeding 1,500 °C), heated directly by solar X-rays and UV rays. But the density of the air is so low that an ordinary thermometer would measure nothing at all: the heat is not transmitted by contact. This is the realm of the polar auroras and of the International Space Station.
- Exosphere (beyond 600 km) — The blurred boundary with space. Atoms gradually escape from it into the interplanetary void.4
Where does space begin?
At an altitude of a hundred kilometres: that is the usual answer. This is the Kármán line.
This number is a rounded figure, and its history is worth telling.
The original calculation did not give a hundred
Theodore von Kármán had sought the altitude above which an aircraft would have to fly so fast to support itself on the air that it would be in orbit anyway. In other words: the altitude at which flying ceases to make sense.5
His calculation gave about 84 kilometres.
A hundred is rounder, more convenient, easier to memorise. A hundred is what stuck.
A delightful detail: the line bears the name of a man who had calculated something else. What he established was an altitude of aerodynamic transition — not an absolute boundary of space.
Not everyone agrees
In 2005, the American space agency recognised as astronauts the pilots who had climbed above 80 kilometres.6
An article published in 2018 in an astronautics journal revisits the problem and proposes setting the limit at 80 kilometres.7
Its argument is worth knowing, because it rests not on convenience but on two measurable things:
- By calculating the altitude at which a satellite can no longer stay up, one finds a value that remains within ten kilometres of 80, whatever the solar and atmospheric conditions. The author writes that this altitude lies between 70 and 90 kilometres, and that a hundred is always too high.
- Moreover, 80 kilometres corresponds to something real: the mesopause, the boundary between two layers of the atmosphere — the one discussed above.8
In other words, one round number is not being replaced by another round number. A convenient number is being replaced by a number that corresponds to a phenomenon.
The international federation that certifies aeronautical records has been examining this change since 2018. As of 2026, it has still not formally adopted it.
A very concrete consequence
Five pilots of an experimental rocket plane (the X-15) flew between 80 and 100 kilometres in the 1960s.
Depending on the definition adopted, they went into space — or not.
The author of the article puts it bluntly: if a hundred kilometres is used instead of eighty, these five men lose their status as space travellers.9
It was not until 2005 that NASA awarded astronaut wings to three civilian X-15 pilots, two of whom were already dead.
It is not the flights, the men or the altitude that change. It is a line drawn by humans, at a place they chose.
What to take away
There is no physical boundary between the atmosphere and space. The air thins out gradually, without ever stopping abruptly — traces of it remain well beyond a hundred kilometres.
Any limit is therefore a convention. This is not a flaw: one is needed, for treaties, records and space law.
But one must be aware that it is one. To read “he went into space” is also to read “according to the definition that was chosen”.
What they found
From the late 1970s onwards, a systematic decline in ozone in the austral spring.
In 1984, the layer above Halley was only about two thirds of its thickness in previous decades — falls of about thirty per cent in October.10
The paper was published on 16 May 1985.11
Satellites then confirmed it: the phenomenon covers the entire continent and often reaches twenty-four million square kilometres. By around 1992, the area affected was equivalent to that of North America.12
A nuance that keeps the story from being too neat
One could tell this as a confirmed prediction: chemists had announced as early as 1974 that certain industrial gases would destroy ozone, and this was observed.
That is not what happened.
What was observed was not what had been predicted. The magnitude, the time of onset, the region concerned and the seasonal character were unexpected in every respect. No study had foreseen a sensitivity to chlorine in the lower Antarctic atmosphere — nobody was looking there.13
So it was not a risky prediction that succeeded.
It was long-term monitoring that found something other than what was being looked for.
It is the same lesson as the eclipses recorded by the astronomers of Babylon nearly three thousand years ago, which today serve to measure the slowing of the Earth: data collected for one reason serve another, decades or centuries later.
What followed
The Vienna Convention in 1985. Then the Montreal Protocol in 1987, which organises the phase-out of the production of the substances concerned (chlorofluorocarbons, or CFCs).14
A 2015 analysis, carried out by the firm Deloitte for British research, estimates that without this discovery, the agreement could have been delayed by five to ten years. The United Nations Environment Programme estimates that thanks to the agreement, up to two million cases of skin cancer will be avoided each year by 2030.15
⚠ These two figures are estimates of what did not happen. They are given with their author and their date, and are not treated as direct measurements.
What came next — the measured recovery, and what did not work — is told in our page on protecting the planet.
The same gas, and its opposite
A distinction must be added, because it changes everything: ozone is good or bad depending on its altitude.
- High up, in the stratosphere, it forms the shield that stops ultraviolet rays. This is the one discussed above.
- Down low, at ground level, it is a corrosive pollutant, dangerous for the respiratory tract and for vegetation.
So it is not only the distant air that is at stake: the air we breathe is too. In 1952, London’s Great Smog, a fog caused by coal, killed thousands of people: 3,000 to 4,000 according to the long-accepted toll, about 12,000 if the following months are also counted. It was the event that triggered modern health regulations: the British Clean Air Act of 1956, then its American counterpart, broadened in 1970, which sets thresholds for six major pollutants — sulphur dioxide, particulate matter, carbon monoxide, ground-level ozone, nitrogen dioxide and lead.16
Note 1
Measurements by the Dobson ozone spectrophotometer at the British Antarctic Survey's (BAS) Halley research station form a record of Antarctic total column ozone that dates back to 1956.
Zhang, Lily N., Solomon, Susan, Stone, Kane A., Shanklin, Jonathan D. et al., “On the Use of Satellite Observations to Fill Gaps in the Halley Station Total Ozone Record”, Atmospheric Chemistry and Physics, vol. 21, 2021, p. 9829-9838
Note 2
The development of research on atmospheric ozone at Oxford is traced from the year 1922, when one single instrument was used there to make measurements of the total ozone, to 1966, when some hundred instruments were distributed all over the world.
Dobson, Gordon M. B., “Forty Years’ Research on Atmospheric Ozone at Oxford: A History”, Applied Optics, vol. 7, no. 3, 1968, p. 387-405, paywalled
Note 3
Being an ignorant physicist, I thought if I took this year’s ozone data and compared it with readings from twenty years earlier it would be the same, and so people needn’t worry. But the readings weren’t the same and so it required following up. […] Shanklin continued to work through his backlog to try to see if that year was just a one off.
UK Research and Innovation (UKRI), “The story behind the discovery of the ozone hole”, 16 September 2021
Note 4
Five distinct layers have been identified using thermal characteristics (temperature changes), chemical composition, movement, and density. […] Between about 53 miles (85 km) and 375 miles (600 km) lies the thermosphere, known as the upper atmosphere.
National Oceanic and Atmospheric Administration, National Weather Service, JetStream, “Layers of the Atmosphere”
Note 5
Thus, in the mid 1950’s, Von Karman got in touch with a series of (at the time) young leading scientist and engineers in Aeronautics and Astronautics with the view of defining a separation, as far as possible, between both disciplines. […] The interchange of ideas was finally conducted to a clear cut: In Aeronautics, level flying higher and higher meant to deal with less and less dense atmosphere, thus to the need of greater and greater speeds to have the flying machine controllable by aerodynamic forces. A speed so big in fact, that, above a certain altitude, could be close or even bigger than the circular orbital speed at that altitude (i.e. lift was no longer needed, since centrifugal force took over; and consequently aerodynamic flight was meaningless).
Sanz Fernández de Córdoba, S., “100km Altitude Boundary for Astronautics”, Fédération Aéronautique Internationale (FAI), International Astronautics Commission, last updated 21 June 2004
Note 6
That inequity was rectified today when retired NASA pilot Bill Dana, and family members representing deceased pilots John B. McKay and Joseph A. Walker, received civilian astronaut wings acknowledging their flights above 264,000 feet altitude – 50 miles high.
NASA, Dryden Flight Research Center, “X-15 Space Pioneers Now Honored as Astronauts”, communiqué de 2005 (no. 05-57 d’après l’adresse de la page)
Note 7
propose 80 kilometers as a more appropriate boundary than the currently popular 100 km Von Kármán line
McDowell, Jonathan C., “The Edge of Space: Revisiting the Karman Line”, Acta Astronautica, vol. 151, 2018, p. 668-677
Note 8
I have shown that for a typical satellite ballistic coefficient the effective Karman line is close to (within 10 km of) 80 km independent of solar and atmospheric conditions
McDowell, Jonathan C., “The Edge of Space: Revisiting the Karman Line”, Acta Astronautica, vol. 151, 2018, p. 668-677
That altitude lies in the 70 to 90 km range, and 100 km is always too high.
McDowell, Jonathan C., “The Edge of Space: Revisiting the Karman Line”, Acta Astronautica, vol. 151, 2018, p. 668-677
an altitude of exactly 80 km, representing the typical location of the mesopause
McDowell, Jonathan C., “The Edge of Space: Revisiting the Karman Line”, Acta Astronautica, vol. 151, 2018, p. 668-677
Note 9
If a limit of 100 km instead of 80 km is used, White, Robert Rushworth, Jack McKay, Bill Dana and Mike Adams lose their space traveler status
McDowell, Jonathan C., “The Edge of Space: Revisiting the Karman Line”, Acta Astronautica, vol. 151, 2018, p. 668-677
Note 10
By 1984, the ozone layer over Halley Research Station in Antarctica was only about two-thirds as thick as it had been in earlier decades.
UK Research and Innovation (UKRI), “The story behind the discovery of the ozone hole”, 16 September 2021
Note 11
Issue Date: 16 May 1985
Farman, Joseph C., Gardiner, Brian G. and Shanklin, Jonathan D., “Large Losses of Total Ozone in Antarctica Reveal Seasonal ClOx/NOx Interaction”, Nature, vol. 315, no. 6016, 16 May 1985, p. 207-210
Note 12
First, ozone hole areas displayed in Figure Q10-2 show that depletion increased after 1980, then became fairly stable in the 1990s, 2000s, and into the mid-2010s, often reaching an area of 24 million square km (about the size of North America).
Organisation météorologique mondiale and Programme des Nations unies pour l’environnement, Scientific Assessment of Ozone Depletion, éditions successives
Note 13
However, the drastic depletion of the October total ozone amounts over the British Antarctic station Halley Bay, as reported by Joseph Farman and colleagues in 1985, was undoubtedly a total surprise. […] Prior to its discovery the scientific consensus was that the effect of ODS, such as CFCs, would be first seen near 40 km where the natural variability of ozone is relatively small. […] The globally averaged change in total column ozone was expected to be only about 1%/decade. Given the large natural variability of the total ozone, and the difficulty of maintaining long-term calibration of instruments to such high accuracy, such changes were not expected to be seen in the data for a decade or longer (Barthia & McPeters, 2018).
Royal Meteorological Institute of Belgium (RMI), “The ozone hole”, research theme Ozone
Note 14
The landmark agreement was signed in 1987 and entered into force in 1989. […] By 1985, the globe had already seen advancements in the scientific understanding of ozone depletion […] It was then that the Vienna Convention for the Protection of the Ozone Layer was created in response.
Secrétariat de l’ozone, Programme des Nations unies pour l’environnement, “Home | Ozone Secretariat”, page d’accueil du site officiel
Note 15
The threat of large increases in skin cancers has been avoided due to the success of the Montreal Protocol on Substances that Deplete the Ozone Layer in controlling ozone depletion, according to the newly published "Environmental Effects of Ozone Depletion and its Interactions with Climate Change: 2014 Assessment" report […] The report explains that, according to some estimates, up to 2 million cases of skin cancer will be prevented each year by 2030, thanks to the successful implementation of the Montreal Protocol and its amendments.
Programme des Nations unies pour l’environnement, “Montreal Protocol Averts Threat of Large Increases in Skin Cancers”, communiqué de presse, Nairobi, 16 January 2015, open access
Consultations with BAS indicated that, given the research and monitoring activities of other countries, such as Japan’s research station Syowa and US efforts to monitor ozone levels via satellite, the ozone hole could have gone undiscovered for between 5 and 10 years if NERC had not made its discovery in 1985. This would have incurred a 5 to 10 year delay in the ratification of the Montreal Protocol to curb the emission of ozone depleting substances and avert an additional reduction in ozone levels.
Deloitte, Impact of NERC-funded research: A report on the economic and social impact of selected NERC-funded research, Natural Environment Research Council, December 2015
Note 16
If the excess deaths in the months after the 1952 London smog are related to air pollution, the mortality count would be approximately 12,000 rather than the 3,000–4,000 generally reported for the episode.
Bell, Michelle L., Davis, Devra L. and Fletcher, Tony, “A Retrospective Assessment of Mortality from the London Smog Episode of 1952: The Role of Influenza and Pollution”, Environmental Health Perspectives, vol. 112, 2004, p. 6-8
Notes and sources
- ↑
Passage At Halley, in Antarctica, the amount of ozone above the station has been measured since 1956.
Measurements by the Dobson ozone spectrophotometer at the British Antarctic Survey's (BAS) Halley research station form a record of Antarctic total column ozone that dates back to 1956.
Source Zhang, Lily N., Solomon, Susan, Stone, Kane A., Shanklin, Jonathan D. et al., “On the Use of Satellite Observations to Fill Gaps in the Halley Station Total Ozone Record”, Atmospheric Chemistry and Physics, vol. 21, 2021, p. 9829-9838, abstract.
Open access open the source · checked on 27 October 2026
- ↑
Passage Year after year, with a ground-based instrument.
The development of research on atmospheric ozone at Oxford is traced from the year 1922, when one single instrument was used there to make measurements of the total ozone, to 1966, when some hundred instruments were distributed all over the world.
Source Dobson, Gordon M. B., “Forty Years’ Research on Atmospheric Ozone at Oxford: A History”, Applied Optics, vol. 7, no. 3, 1968, p. 387-405, paywalled, abstract of the article (p. 387).
Paywalled open the source · checked on 24 October 2026
- ↑
Passage he took the year’s readings and compared them with those from twenty years earlier, expecting to find them identical […] So he went back through the whole backlog of data
Being an ignorant physicist, I thought if I took this year’s ozone data and compared it with readings from twenty years earlier it would be the same, and so people needn’t worry. But the readings weren’t the same and so it required following up. […] Shanklin continued to work through his backlog to try to see if that year was just a one off.
Source UK Research and Innovation (UKRI), “The story behind the discovery of the ozone hole”, 16 September 2021, “Interview: preserving the ozone layer, then and now” section (answer by Jonathan Shanklin, then a sentence from the same section).
Open access open the source · checked on 24 October 2026
- ↑
Passage Troposphere […] Stratosphere […] Mesosphere […] Thermosphere […] Exosphere
Five distinct layers have been identified using thermal characteristics (temperature changes), chemical composition, movement, and density. […] Between about 53 miles (85 km) and 375 miles (600 km) lies the thermosphere, known as the upper atmosphere.
Source National Oceanic and Atmospheric Administration, National Weather Service, JetStream, “Layers of the Atmosphere”, introduction of the page; then sections devoted to each layer (Exosphere, Thermosphere, Mesosphere, Stratosphere, Troposphere).
Open access open the source · checked on 24 October 2026
- ↑
Passage Theodore von Kármán had sought the altitude above which an aircraft would have to fly so fast to support itself on the air that it would be in orbit anyway.
Thus, in the mid 1950’s, Von Karman got in touch with a series of (at the time) young leading scientist and engineers in Aeronautics and Astronautics with the view of defining a separation, as far as possible, between both disciplines. […] The interchange of ideas was finally conducted to a clear cut: In Aeronautics, level flying higher and higher meant to deal with less and less dense atmosphere, thus to the need of greater and greater speeds to have the flying machine controllable by aerodynamic forces. A speed so big in fact, that, above a certain altitude, could be close or even bigger than the circular orbital speed at that altitude (i.e. lift was no longer needed, since centrifugal force took over; and consequently aerodynamic flight was meaningless).
Source Sanz Fernández de Córdoba, S., “100km Altitude Boundary for Astronautics”, Fédération Aéronautique Internationale (FAI), International Astronautics Commission, last updated 21 June 2004, § 2 (“The separation of Aeronautics and Astronautics”), a (“The idea of separating both fields”) and b (“The Karman separation line: Scientific significance”), 1st paragraph.
Open access open the source · checked on 27 October 2026
- ↑
Passage In 2005, the American space agency recognised as astronauts the pilots who had climbed above 80 kilometres.
That inequity was rectified today when retired NASA pilot Bill Dana, and family members representing deceased pilots John B. McKay and Joseph A. Walker, received civilian astronaut wings acknowledging their flights above 264,000 feet altitude – 50 miles high.
Source NASA, Dryden Flight Research Center, “X-15 Space Pioneers Now Honored as Astronauts”, communiqué de 2005 (no. 05-57 d’après l’adresse de la page), second paragraph of the press release.
Open access open the source · checked on 24 October 2026
- ↑
Passage An article published in 2018 in an astronautics journal revisits the problem and proposes setting the limit at 80 kilometres.
propose 80 kilometers as a more appropriate boundary than the currently popular 100 km Von Kármán line
Source McDowell, Jonathan C., “The Edge of Space: Revisiting the Karman Line”, Acta Astronautica, vol. 151, 2018, p. 668-677, abstract.
Open access open the source · checked on 9 September 2026
- ↑
Passage a value that remains within ten kilometres of 80, whatever the solar and atmospheric conditions
I have shown that for a typical satellite ballistic coefficient the effective Karman line is close to (within 10 km of) 80 km independent of solar and atmospheric conditions
Source McDowell, Jonathan C., “The Edge of Space: Revisiting the Karman Line”, Acta Astronautica, vol. 151, 2018, p. 668-677, section 6 (conclusion).
Open access open the source · checked on 9 September 2026
Passage this altitude lies between 70 and 90 kilometres, and […] a hundred is always too high
That altitude lies in the 70 to 90 km range, and 100 km is always too high.
Source McDowell, Jonathan C., “The Edge of Space: Revisiting the Karman Line”, Acta Astronautica, vol. 151, 2018, p. 668-677, section 5.3.
Open access open the source · checked on 9 September 2026
Passage 80 kilometres corresponds to something real: the mesopause
an altitude of exactly 80 km, representing the typical location of the mesopause
Source McDowell, Jonathan C., “The Edge of Space: Revisiting the Karman Line”, Acta Astronautica, vol. 151, 2018, p. 668-677, section 1.3.
Open access open the source · checked on 9 September 2026
- ↑
Passage if a hundred kilometres is used instead of eighty, these five men lose their status as space travellers
If a limit of 100 km instead of 80 km is used, White, Robert Rushworth, Jack McKay, Bill Dana and Mike Adams lose their space traveler status
Source McDowell, Jonathan C., “The Edge of Space: Revisiting the Karman Line”, Acta Astronautica, vol. 151, 2018, p. 668-677, body of the article.
Open access open the source · checked on 9 September 2026
- ↑
Passage In 1984, the layer above Halley was only about two thirds of its thickness in previous decades
By 1984, the ozone layer over Halley Research Station in Antarctica was only about two-thirds as thick as it had been in earlier decades.
Source UK Research and Innovation (UKRI), “The story behind the discovery of the ozone hole”, 16 September 2021, “A decline in spring ozone” section, 2nd paragraph.
Open access open the source · checked on 27 October 2026
- ↑
Passage The paper was published on 16 May 1985.
Issue Date: 16 May 1985
Source Farman, Joseph C., Gardiner, Brian G. and Shanklin, Jonathan D., “Large Losses of Total Ozone in Antarctica Reveal Seasonal ClOx/NOx Interaction”, Nature, vol. 315, no. 6016, 16 May 1985, p. 207-210, article page on nature.com, publication information (“Issue Date”).
Paywalled open the source · checked on 25 October 2026
- ↑
Passage the phenomenon covers the entire continent and often reaches twenty-four million square kilometres
First, ozone hole areas displayed in Figure Q10-2 show that depletion increased after 1980, then became fairly stable in the 1990s, 2000s, and into the mid-2010s, often reaching an area of 24 million square km (about the size of North America).
Source Organisation météorologique mondiale and Programme des Nations unies pour l’environnement, Scientific Assessment of Ozone Depletion, éditions successives, Scientific Assessment of Ozone Depletion: 2018, “Twenty Questions and Answers About the Ozone Layer”, question 10, “Long-term total ozone changes” section.
Open access · checked on 24 October 2026
- ↑
Passage What was observed was not what had been predicted. The magnitude, the time of onset, the region concerned and the seasonal character were unexpected in every respect.
However, the drastic depletion of the October total ozone amounts over the British Antarctic station Halley Bay, as reported by Joseph Farman and colleagues in 1985, was undoubtedly a total surprise. […] Prior to its discovery the scientific consensus was that the effect of ODS, such as CFCs, would be first seen near 40 km where the natural variability of ozone is relatively small. […] The globally averaged change in total column ozone was expected to be only about 1%/decade. Given the large natural variability of the total ozone, and the difficulty of maintaining long-term calibration of instruments to such high accuracy, such changes were not expected to be seen in the data for a decade or longer (Barthia & McPeters, 2018).
Source Royal Meteorological Institute of Belgium (RMI), “The ozone hole”, research theme Ozone, section “History” (paragraph on Farman et al., 1985) and section “Processes”, 1st paragraph.
Open access open the source · checked on 27 October 2026
- ↑
Passage The Vienna Convention in 1985. Then the Montreal Protocol in 1987
The landmark agreement was signed in 1987 and entered into force in 1989. […] By 1985, the globe had already seen advancements in the scientific understanding of ozone depletion […] It was then that the Vienna Convention for the Protection of the Ozone Layer was created in response.
Source Secrétariat de l’ozone, Programme des Nations unies pour l’environnement, “Home | Ozone Secretariat”, page d’accueil du site officiel, home page, “Montreal Protocol” and “Vienna Convention” sections.
Open access open the source · checked on 9 September 2026
- ↑
Passage thanks to the agreement, up to two million cases of skin cancer will be avoided each year by 2030
The threat of large increases in skin cancers has been avoided due to the success of the Montreal Protocol on Substances that Deplete the Ozone Layer in controlling ozone depletion, according to the newly published "Environmental Effects of Ozone Depletion and its Interactions with Climate Change: 2014 Assessment" report […] The report explains that, according to some estimates, up to 2 million cases of skin cancer will be prevented each year by 2030, thanks to the successful implementation of the Montreal Protocol and its amendments.
Source Programme des Nations unies pour l’environnement, “Montreal Protocol Averts Threat of Large Increases in Skin Cancers”, communiqué de presse, Nairobi, 16 January 2015, open access, standfirst and body of the press release.
Open access open the source · checked on 25 October 2026
Passage A 2015 analysis, carried out by the firm Deloitte for British research, estimates that without this discovery, the agreement could have been delayed by five to ten years
Consultations with BAS indicated that, given the research and monitoring activities of other countries, such as Japan’s research station Syowa and US efforts to monitor ozone levels via satellite, the ozone hole could have gone undiscovered for between 5 and 10 years if NERC had not made its discovery in 1985. This would have incurred a 5 to 10 year delay in the ratification of the Montreal Protocol to curb the emission of ozone depleting substances and avert an additional reduction in ozone levels.
Source Deloitte, Impact of NERC-funded research: A report on the economic and social impact of selected NERC-funded research, Natural Environment Research Council, December 2015, p. 11, section 3.4.1 (chapter 3, “Stratospheric ozone depletion”).
Open access open the source · checked on 25 October 2026
- ↑
Passage In 1952, London’s Great Smog […] killed thousands of people: 3,000 to 4,000 according to the long-accepted toll, about 12,000 if the following months are also counted.
If the excess deaths in the months after the 1952 London smog are related to air pollution, the mortality count would be approximately 12,000 rather than the 3,000–4,000 generally reported for the episode.
Source Bell, Michelle L., Davis, Devra L. and Fletcher, Tony, “A Retrospective Assessment of Mortality from the London Smog Episode of 1952: The Role of Influenza and Pollution”, Environmental Health Perspectives, vol. 112, 2004, p. 6-8, p. 8, Discussion.
Open access · checked on 24 October 2026
Bibliography
16
- Bell, Michelle L., Davis, Devra L. and Fletcher, Tony, “A Retrospective Assessment of Mortality from the London Smog Episode of 1952: The Role of Influenza and Pollution”, Environmental Health Perspectives, vol. 112, 2004, p. 6-8, open access (the upward revision of the Great Smog’s toll).
- Christie, Maureen, The Ozone Layer: A Philosophy of Science Perspective, Cambridge University Press, 2000, in libraries (the complete history of the measurements at Halley since 1956; the analysis of what had been predicted and what was observed).
- Deloitte, Impact of NERC-funded research: A report on the economic and social impact of selected NERC-funded research, Natural Environment Research Council, December 2015, open access (without the discovery of the ozone hole by the British Antarctic Survey in 1985, the ratification of the Montreal Protocol could have been delayed by five to ten years). https://www.ukri.org/wp-content/uploads/2021/12/201221-NERC-DeloitteImpactReport.pdf
- Dobson, Gordon M. B., “Forty Years’ Research on Atmospheric Ozone at Oxford: A History”, Applied Optics, vol. 7, no. 3, 1968, p. 387-405, paywalled (the setting up of the measurement network: from a single instrument at Oxford in 1922 to some hundred instruments distributed around the world in 1966). https://doi.org/10.1364/AO.7.000387
- Farman, Joseph C., Gardiner, Brian G. and Shanklin, Jonathan D., “Large Losses of Total Ozone in Antarctica Reveal Seasonal ClOx/NOx Interaction”, Nature, vol. 315, no. 6016, 16 May 1985, p. 207-210, paywalled (the original publication; the measurements concern the Halley and Faraday stations). https://doi.org/10.1038/315207a0
- McDowell, Jonathan C., “The Edge of Space: Revisiting the Karman Line”, Acta Astronautica, vol. 151, 2018, p. 668-677, open access (the 80 km proposal; the effective line within ten kilometres of 80 whatever the conditions, in a range of 70 to 90; “100 km is always too high”; the correspondence with the mesopause; the five X-15 pilots who would lose their status with a 100 km threshold). https://arxiv.org/abs/1807.07894
- NASA, Dryden Flight Research Center, “X-15 Space Pioneers Now Honored as Astronauts”, communiqué de 2005 (no. 05-57 d’après l’adresse de la page), open access (the award, in 2005, of civilian astronaut wings to three X-15 pilots for their flights above 50 miles, or about 80 km). https://www.nasa.gov/centers/dryden/news/NewsReleases/2005/05-57.html
- National Oceanic and Atmospheric Administration, National Weather Service, JetStream, “Layers of the Atmosphere”, open access (the layers, their altitudes and their temperature profiles). https://www.noaa.gov/jetstream/atmosphere/layers-of-atmosphere
- Organisation météorologique mondiale and Programme des Nations unies pour l’environnement, Scientific Assessment of Ozone Depletion, éditions successives, open access (the extent of the hole measured by satellite).
- Programme des Nations unies pour l’environnement, “Montreal Protocol Averts Threat of Large Increases in Skin Cancers”, communiqué de presse, Nairobi, 16 January 2015, open access (the 2014 report of the Montreal Protocol’s Environmental Effects Assessment Panel: up to two million cases of skin cancer avoided each year by 2030). https://www.unep.org/news-and-stories/press-release/montreal-protocol-averts-threat-large-increases-skin-cancers
- Royal Meteorological Institute of Belgium (RMI), “The ozone hole”, research theme Ozone, open access (what was predicted: an effect first seen near 40 km, about 1% per decade in the global average, undetectable for a decade or more; what was observed: the drastic fall in October ozone over Halley, “a total surprise”). https://www.meteo.be/en/research-themes/ozone/the-ozone-hole
- Sanz Fernández de Córdoba, S., “100km Altitude Boundary for Astronautics”, Fédération Aéronautique Internationale (FAI), International Astronautics Commission, last updated 21 June 2004, open access (the reasoning brought together by von Kármán: above a certain altitude, the speed needed for aerodynamic flight reaches orbital speed; the boundary rounded to 100 km). https://www.fai.org/page/icare-boundary
- Secrétariat de l’ozone, Programme des Nations unies pour l’environnement, “Home | Ozone Secretariat”, page d’accueil du site officiel, open access (the Vienna Convention created in 1985; the Montreal Protocol signed in 1987). https://ozone.unep.org/
- UK Research and Innovation (UKRI), “The story behind the discovery of the ozone hole”, 16 September 2021, avec l’entretien “Interview: preserving the ozone layer, then and now” de Jonathan Shanklin, open access (the open day, the comparison with the readings from twenty years earlier that he thought would be identical, the working through of the data backlog). https://www.ukri.org/who-we-are/how-we-are-doing/research-outcomes-and-impact/nerc/the-story-behind-the-discovery-of-the-ozone-hole/
- Von Kármán, Theodore, avec Edson, Lee, The Wind and Beyond: Theodore von Kármán, Pioneer in Aviation and Pathfinder in Space, Little, Brown, 1967, in libraries (the original calculation of the altitude of aerodynamic transition).
- Zhang, Lily N., Solomon, Susan, Stone, Kane A., Shanklin, Jonathan D. et al., “On the Use of Satellite Observations to Fill Gaps in the Halley Station Total Ozone Record”, Atmospheric Chemistry and Physics, vol. 21, 2021, p. 9829-9838, open access (the Halley total ozone record, measured with a Dobson spectrophotometer since 1956). https://doi.org/10.5194/acp-21-9829-2021
Spotted an error or have a doubt? Write to us.