
A cold day tells us nothing about the climate. Neither does a hot year.
This page explains why, and offers a tool that keeps you from being misled.
Two words, two timescales
Weather is the state of the atmosphere at a given moment: it is raining, it is ten degrees, the wind is blowing from the north.
Climate is the statistics of those states over a long period — the average, but also the usual variations, the extremes and the seasons.
The difference between the two is not a difference in kind: it is a difference in duration.
The period used is a historical convention: science set an arbitrary number of years over which a climate is calculated, so as to have a common reference point.
The tool that prevents the mistake
The distinction set out in our entries on the ocean and on water applies exactly here: a flow is not a stock. What passes through is not what remains.
Applied to climate, it becomes: a single day’s value is not a trend.
A day of frost in April is a single day’s value. It is real, measured, indisputable — and it says nothing about the trend, because a trend is a property of a whole set, not of an isolated point.
It is the same principle as with a coin: a single toss gives no information about the coin, whereas a thousand tosses reveal how it behaves. The thousand and first toss does not call the overall statistics into question.
Hence a fundamental rule that cuts both ways: you cannot refute a trend with a single day, and you cannot prove one with it either.
What an atmosphere does to climate
To understand the role of the atmosphere, the best example comes from another planet: Venus.
On Venus, there is almost no temperature difference: neither between the poles and the equator, nor between day and night. Everywhere at a given altitude, and at all times, the same extreme heat prevails.1
Its hyperdense atmosphere redistributes heat throughout the whole system before any thermal difference can take hold.
On Earth, the atmosphere is thinner: it is cold at the poles and hot at the equator, cold at night and hot during the day. These temperature differences generate winds, rain and ocean currents.
An atmosphere does not merely retain heat: it moves it around. It is this continual movement that creates climate zones.
Where do the seasons come from?
The seasons do not depend on the Earth’s distance from the Sun.
One fact settles the question in a single sentence. The Earth receives about 7% more solar energy in January than in July, because it is closer to the Sun at that time.2
January is winter in the northern hemisphere.
If distance governed the seasons, it would be warmer in Paris in January than in July. The opposite is true.
The seasons come almost entirely from the tilt of the Earth’s axis of rotation (about 23.4° from the perpendicular to the plane of its orbit).3
- In summer, the hemisphere concerned is tilted towards the Sun: the rays strike the ground more directly (the energy is concentrated on a smaller area) and the days are longer.
- In winter, the hemisphere concerned is tilted away: the rays arrive at a low, glancing angle (the same energy is spread over a large area) and the days are shorter.
The teaching trap, and what it reveals
In a now-famous study, a team questioned students, graduates and teaching staff at a graduation ceremony at a major American university. The question: what causes the seasons?4
Of twenty-three people questioned, twenty-one were unable to answer correctly.5
The most frequent answer: that the Earth is closer to the Sun in summer.6
But that is not the most interesting result. That comes later in the film.
The researchers then followed secondary-school pupils while they were being taught the real explanation. They observed that many did not abandon the old idea. They merged it with the new one — assuming that the tilt of the axis brings one hemisphere closer to the Sun.7
Some accepted the new idea. Some blended the two. Some reverted entirely to the old one.8
This point deserves attention, because it does not concern only the seasons. A false idea is not swapped out like a spare part: it resists, it disguises itself, it absorbs whatever is set against it. That is why hearing the right explanation once is not enough.
To remember the real cause, just think of summer days: the sun is higher in the sky and concentrates its light, like a torch held straight above a table.
Interactive
Where do the seasons come from?
The Earth is closest to the Sun in January, in the depths of the northern winter.
The question
In January, the Earth is closer to the Sun: so why is it winter in the northern hemisphere?
What you do Run through the year: the Earth goes round the Sun, its axis always tilted the same way. Change the latitude or the tilt, and watch the height of the Sun, the length of the day and the energy received.
Without JavaScript, here are the animation’s data.
| Fact | Value | Source |
|---|---|---|
| Tilt of the Earth’s axis of rotation | about 23.4° | 1 |
| Solar energy received in January compared with July (effect of distance) | about 7% more | 2 |
| Date | Height of the Sun at noon | Length of day | Energy received over the day (equinox = 100) |
|---|---|---|---|
| June solstice | 68.4° | 15 h 25 min | 163 |
| March and September equinoxes | 45° | 12 h | 100 |
| December solstice | 21.6° | 8 h 35 min | 38 |
The values in the second table, and in the animation, are calculated: spherical geometry, an orbit assumed to be circular, with no atmosphere or refraction. The effect of distance is added separately, from the article’s figure (7%).
The takeaway The distance to the Sun changes the energy received by only about 7%. The tilt changes it far more: without it, no seasons.
Photo credits 4
- The Sun in visible light, photographed by NASA’s SDO satellite on 10 August 2024. NASA/SDO, AIA, EVE and HMI science teams, Public domain, source
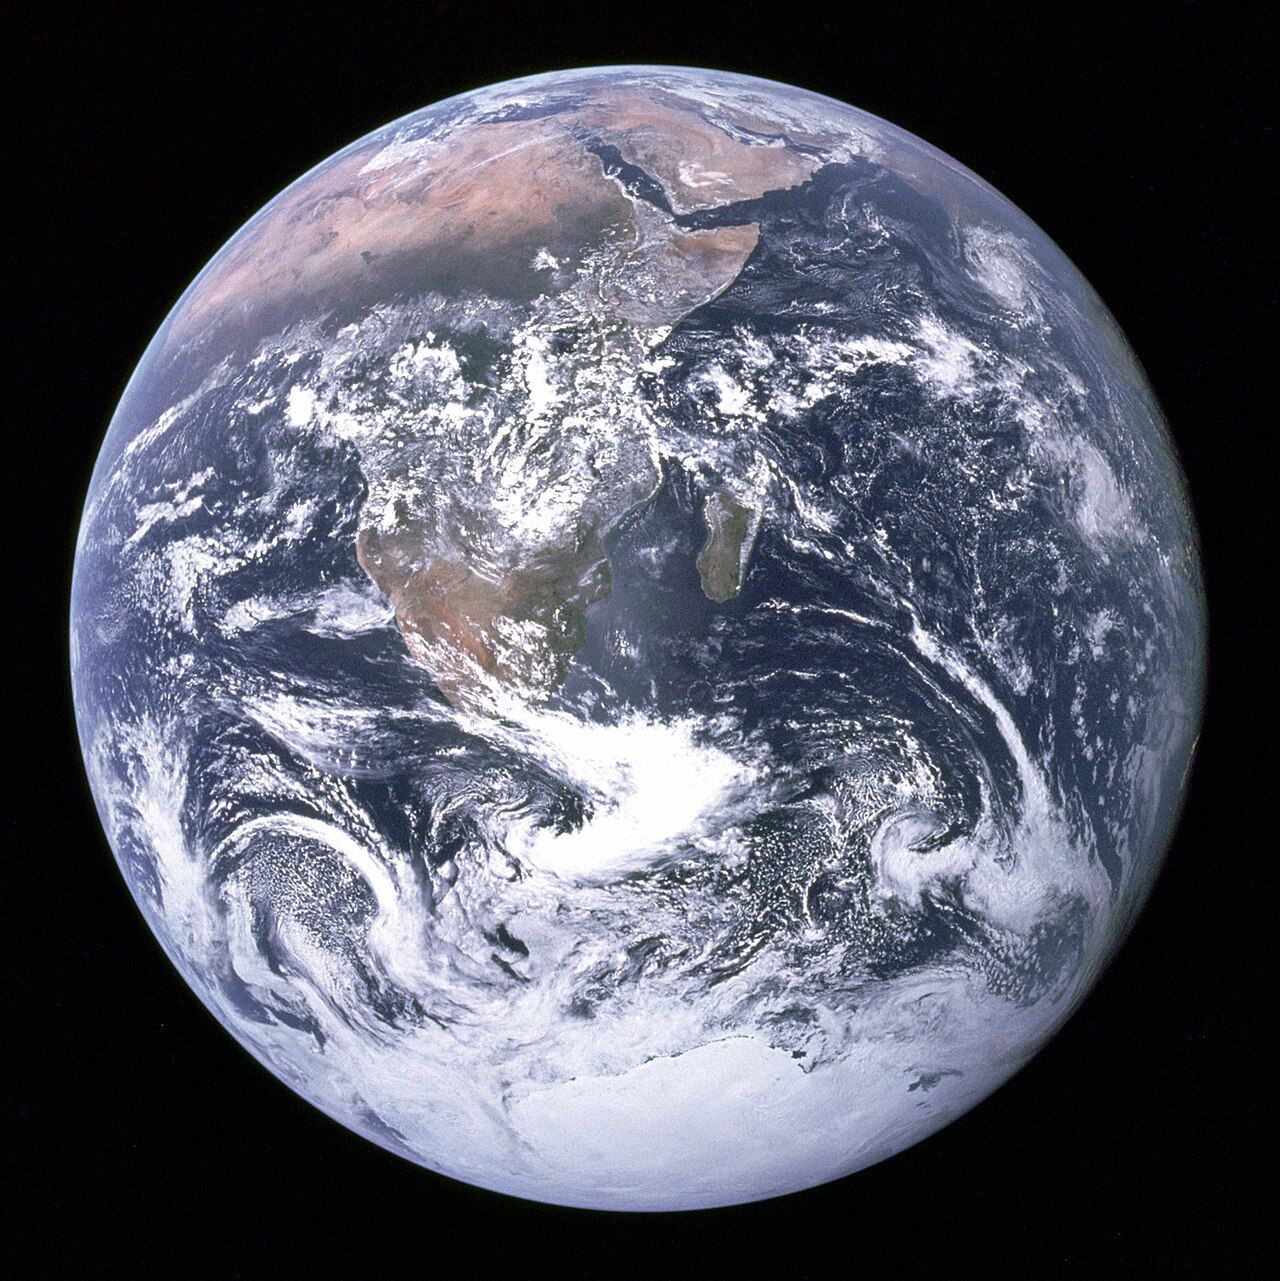
- The Earth photographed on 7 December 1972 by the Apollo 17 crew on their way to the Moon: Africa, Antarctica and the Arabian Peninsula are visible. NASA, Apollo 17 crew, Public domain, source
- The Earth seen by the Meteosat satellite on 21 December 2010, 20 March, 21 June and 20 September 2011 (NASA). NASA (Meteosat images), Public domain, source
- Blue Marble: Next Generation, with land topography and sea-floor bathymetry, in equirectangular projection: map produced by Reto Stöckli, NASA Earth Observatory (NASA Goddard Space Flight Center). Reto Stöckli, NASA Earth Observatory, modified by NordNordWest, Public domain, source


Sources 2
Williams, David R., “Planetary Fact Sheet – Metric”, NASA Goddard Space Flight Center (NSSDCA), updated 18 March 2025, row “Obliquity to Orbit (degrees)”, column Earth (third value; the columns run from Mercury to Pluto, with Moon after Earth).
Obliquity to Orbit (degrees) 0.034 177.4 23.4 6.7 25.2 3.1 26.7 97.8 28.3 119.5
Open access open the source · checked on 28 October 2026
StarChild Team, NASA Goddard Space Flight Center (HEASARC), “When is Earth closest to the Sun?”, StarChild, answer to the question of the month (January 2003).
Relatively speaking, Earth's distance from the Sun doesn't change all that much throughout the year, nevertheless there are measurable differences in solar heating that result from our planet's slightly elliptical orbit. Averaged over the globe, sunlight falling on Earth in January is about 7% more intense than it is in July.
Open access open the source · checked on 9 September 2026
Why thirty years?
To define the climate of a place, the World Meteorological Organization (WMO) averages measurements over thirty years.9
The reason for this choice was entirely pragmatic: in 1935, when the rule was set, only thirty years of data were available to summarise.10
The period chosen was the one available, not the physically ideal one.
A changing rule
In 2015, the WMO updated its standard: it now uses rolling thirty-year reference periods, revised every ten years (1981-2010, then 1991-2020), to better reflect the speed of current climate change.11
In the scientific literature, this thirty-year period is sometimes debated: depending on whether one is studying natural variability or a rapid shift, other time windows prove better suited.
Climate zones and their shifting thresholds
The most widely used climate classification (Köppen-Geiger) divides the world according to temperature and precipitation.12
However, its thresholds vary from one version to another. For the boundary between temperate and continental climates, the threshold for the temperature of the coldest month ranges between 0 °C and -3 °C depending on the author.13
A three-degree difference is enough to shift climate boundaries by hundreds of kilometres.
Note: The “mountain climate” group found on many school maps does not belong to the original Köppen classification. It is a simplified addition for teaching purposes.
Boundaries on the move
Historical maps covering the period 1901-2010 show that many regions of the world changed climate category at least once in little more than a century.14
A territory can switch from one zone to another without any abrupt break in the landscape: all it takes is for an average to cross a predetermined theoretical threshold.
A climate map is not a fixed truth. It is a conventional division applied to variable measurements.
Climate zones in brief
How many climate zones are there on Earth? The answer depends entirely on the classification used and the level of detail desired.
Between two zones there is never a rigid line but a continuous gradient. A sharp boundary is a methodological decision.
Note 1
The thick atmosphere also imposes a uniform temperature between day and night, at the surface, at constant altitude, while in the upper atmosphere, above ≈100 km, day/night temperature variations are of the order of 100 K. Variations of temperature with longitude and latitude are relatively small, especially in the lower atmosphere, below ≈60 km.
Gillmann, Cedric, Arney, Giada N., Avice, Guillaume, Dyar, M. Darby, Golabek, Gregor J., Gülcher, Anna J. P., Johnson, Natasha M., Lefevre, Maxence and Widemann, Thomas, “Venus”, preprint arXiv:2404.07669, 2024
Note 2
Relatively speaking, Earth's distance from the Sun doesn't change all that much throughout the year, nevertheless there are measurable differences in solar heating that result from our planet's slightly elliptical orbit. Averaged over the globe, sunlight falling on Earth in January is about 7% more intense than it is in July.
StarChild Team, NASA Goddard Space Flight Center (HEASARC), “When is Earth closest to the Sun?”, StarChild
Note 3
The challenge for teachers is to help students evaluate why seasons on Earth are caused overwhelming by Earth’s tilt and not significantly by variation in the distance from the Sun. […] Circa 200 BCE, Eratosthenes measured the difference between the midday altitude of the Sun on the summer and winter solstices and, dividing by half, calculated today's figure of approximately 23.5°.
De Paor, Declan G., Dordevic, Mladen M., Karabinos, Paul M., Burgin, Stephen R., Coba, Filis and Whitmeyer, Steven J., “Exploring the Reasons for the Seasons Using Google Earth, 3D Models, and Plots”, International Journal of Digital Earth, vol. 10, no. 6, 2017 (en ligne 2016), p. 582-603, open access
Obliquity to Orbit (degrees) 0.034 177.4 23.4 6.7 25.2 3.1 26.7 97.8 28.3 119.5
Williams, David R., “Planetary Fact Sheet – Metric”, NASA Goddard Space Flight Center (NSSDCA), updated 18 March 2025
Note 4
The seminal study entitled A Private Universe (Schneps et al. 1989) dramatically showed how pervasive and persistent are people's – even highly educated people's – misconceptions regarding basic concepts in planetary science. When interviewed at a commencement ceremony, 21 of 23 Harvard students, alumni, and faculty could not correctly explain the phases of the Moon nor the causes of seasons.
De Paor, Declan G., Dordevic, Mladen M., Karabinos, Paul M., Burgin, Stephen R., Coba, Filis and Whitmeyer, Steven J., “Exploring the Reasons for the Seasons Using Google Earth, 3D Models, and Plots”, International Journal of Digital Earth, vol. 10, no. 6, 2017 (en ligne 2016), p. 582-603, open access
Note 5
When interviewed at a commencement ceremony, 21 of 23 Harvard students, alumni, and faculty could not correctly explain the phases of the Moon nor the causes of seasons.
De Paor, Declan G., Dordevic, Mladen M., Karabinos, Paul M., Burgin, Stephen R., Coba, Filis and Whitmeyer, Steven J., “Exploring the Reasons for the Seasons Using Google Earth, 3D Models, and Plots”, International Journal of Digital Earth, vol. 10, no. 6, 2017 (en ligne 2016), p. 582-603, open access
Note 6
Seasonal change was most commonly ascribed to large variations in Earth's distance from the Sun
De Paor, Declan G., Dordevic, Mladen M., Karabinos, Paul M., Burgin, Stephen R., Coba, Filis and Whitmeyer, Steven J., “Exploring the Reasons for the Seasons Using Google Earth, 3D Models, and Plots”, International Journal of Digital Earth, vol. 10, no. 6, 2017 (en ligne 2016), p. 582-603, open access
Note 7
As students learn about the relevance of the tilt of the Earth's axis, they integrate this new idea with what they already believe by assuming that the tilt brings one hemisphere closer to the Sun than the other.
Bekaert, Hans, Van Winckel, Hans, Van Dooren, Wim, Steegen, An and De Cock, Mieke, “Design and Validation of an Instrument to Test Students’ Understanding of the Apparent Motion of the Sun and Stars”, Physical Review Physics Education Research, vol. 16, 020135, 2020, open access
Note 8
the students would often let go of them and accept the new ideas they were being taught, but would occasionally try to blend the old and new ideas or revert to the old ideas entirely
Science Education Resource Center (SERC), Carleton College, notice “A Private Universe” (description du film de Matthew H. Schneps et Philip M. Sadler)
Note 9
Averages of climatological data computed for the following consecutive periods of 30 years: 1 January 1981–31 December 2010, 1 January 1991–31 December 2020, and so forth.
Organisation météorologique mondiale, WMO Guidelines on the Calculation of Climate Normals, OMM-N° 1203, Genève, 2017
Note 10
The 30-year period of reference was set as a standard mainly because only 30 years of data were available for summarization when the recommendation was first made.
Organisation météorologique mondiale, WMO Guidelines on the Calculation of Climate Normals, OMM-N° 1203, Genève, 2017
Note 11
Climatological standard normals. Averages of climatological data computed for the following consecutive periods of 30 years: 1 January 1981–31 December 2010, 1 January 1991–31 December 2020, and so forth. […] it has been decided that these should be updated every 10 years, with the next update due after the end of 2020.
Organisation météorologique mondiale, WMO Guidelines on the Calculation of Climate Normals, OMM-N° 1203, Genève, 2017
Note 12
The climate classification based on the work of Wladimir Köppen, and dating from 1900, continues to be the most widely used climate classification over a century later. […] the precipitation and temperature based variables used in the criteria to determine the Köppen-Geiger climate type […]
Peel, Murray C., Finlayson, Brian L. and McMahon, Thomas A., “Updated World Map of the Köppen-Geiger Climate Classification”, Hydrology and Earth System Sciences, vol. 11, 2007, p. 1633-1644
Note 13
We have followed Russell (1931) and used the temperature of the coldest month >0 °C, rather than >–3 °C as used by Köppen in defining the temperate – cold climate boundary (see Wilcox, 1968 and Essenwanger, 2001 for a history of this modification).
Peel, Murray C., Finlayson, Brian L. and McMahon, Thomas A., “Updated World Map of the Köppen-Geiger Climate Classification”, Hydrology and Earth System Sciences, vol. 11, 2007, p. 1633-1644
Note 14
This work used a global temperature and precipitation observation dataset to reveal variations and changes of climate over the period 1901–2010 […] Otherwise this grid point is taken as having varying climates on a given time scale since it contains more than one climate type over the time period considered. […] On the interannual, interdecadal, and 30 year time scales, the climate type for a given grid may shift from one type to another
Chen, Deliang and Chen, Hans Weiteng, “Using the Köppen Classification to Quantify Climate Variation and Change: An Example for 1901–2010”, Environmental Development, vol. 6, 2013, p. 69-79
Notes and sources
- ↑
Passage On Venus, there is almost no temperature difference: neither between the poles and the equator, nor between day and night.
The thick atmosphere also imposes a uniform temperature between day and night, at the surface, at constant altitude, while in the upper atmosphere, above ≈100 km, day/night temperature variations are of the order of 100 K. Variations of temperature with longitude and latitude are relatively small, especially in the lower atmosphere, below ≈60 km.
Source Gillmann, Cedric, Arney, Giada N., Avice, Guillaume, Dyar, M. Darby, Golabek, Gregor J., Gülcher, Anna J. P., Johnson, Natasha M., Lefevre, Maxence and Widemann, Thomas, “Venus”, preprint arXiv:2404.07669, 2024, section 3.3 “Greenhouse effect and structure”.
Open access open the source · checked on 25 October 2026
- ↑
Passage The Earth receives about 7% more solar energy in January than in July
Relatively speaking, Earth's distance from the Sun doesn't change all that much throughout the year, nevertheless there are measurable differences in solar heating that result from our planet's slightly elliptical orbit. Averaged over the globe, sunlight falling on Earth in January is about 7% more intense than it is in July.
Source StarChild Team, NASA Goddard Space Flight Center (HEASARC), “When is Earth closest to the Sun?”, StarChild, answer to the question of the month (January 2003).
Open access open the source · checked on 9 September 2026
- ↑
Passage The seasons come almost entirely from the tilt of the Earth’s axis of rotation
The challenge for teachers is to help students evaluate why seasons on Earth are caused overwhelming by Earth’s tilt and not significantly by variation in the distance from the Sun. […] Circa 200 BCE, Eratosthenes measured the difference between the midday altitude of the Sun on the summer and winter solstices and, dividing by half, calculated today's figure of approximately 23.5°.
Source De Paor, Declan G., Dordevic, Mladen M., Karabinos, Paul M., Burgin, Stephen R., Coba, Filis and Whitmeyer, Steven J., “Exploring the Reasons for the Seasons Using Google Earth, 3D Models, and Plots”, International Journal of Digital Earth, vol. 10, no. 6, 2017 (en ligne 2016), p. 582-603, open access, section 2 and section 2.2, p. 583.
Open access open the source · checked on 9 September 2026
Passage about 23.4° from the perpendicular to the plane of its orbit
Obliquity to Orbit (degrees) 0.034 177.4 23.4 6.7 25.2 3.1 26.7 97.8 28.3 119.5
Source Williams, David R., “Planetary Fact Sheet – Metric”, NASA Goddard Space Flight Center (NSSDCA), updated 18 March 2025, row “Obliquity to Orbit (degrees)”, column Earth (third value; the columns run from Mercury to Pluto, with Moon after Earth).
Open access open the source · checked on 28 October 2026
- ↑
Passage In a now-famous study, a team questioned students, graduates and teaching staff
The seminal study entitled A Private Universe (Schneps et al. 1989) dramatically showed how pervasive and persistent are people's – even highly educated people's – misconceptions regarding basic concepts in planetary science. When interviewed at a commencement ceremony, 21 of 23 Harvard students, alumni, and faculty could not correctly explain the phases of the Moon nor the causes of seasons.
Source De Paor, Declan G., Dordevic, Mladen M., Karabinos, Paul M., Burgin, Stephen R., Coba, Filis and Whitmeyer, Steven J., “Exploring the Reasons for the Seasons Using Google Earth, 3D Models, and Plots”, International Journal of Digital Earth, vol. 10, no. 6, 2017 (en ligne 2016), p. 582-603, open access, section 1 “Introduction”, p. 582.
Open access open the source · checked on 24 October 2026
- ↑
Passage Of twenty-three people questioned, twenty-one were unable to answer correctly.
When interviewed at a commencement ceremony, 21 of 23 Harvard students, alumni, and faculty could not correctly explain the phases of the Moon nor the causes of seasons.
Source De Paor, Declan G., Dordevic, Mladen M., Karabinos, Paul M., Burgin, Stephen R., Coba, Filis and Whitmeyer, Steven J., “Exploring the Reasons for the Seasons Using Google Earth, 3D Models, and Plots”, International Journal of Digital Earth, vol. 10, no. 6, 2017 (en ligne 2016), p. 582-603, open access, body of the article.
Open access open the source · checked on 9 September 2026
- ↑
Passage The most frequent answer: that the Earth is closer to the Sun in summer.
Seasonal change was most commonly ascribed to large variations in Earth's distance from the Sun
Source De Paor, Declan G., Dordevic, Mladen M., Karabinos, Paul M., Burgin, Stephen R., Coba, Filis and Whitmeyer, Steven J., “Exploring the Reasons for the Seasons Using Google Earth, 3D Models, and Plots”, International Journal of Digital Earth, vol. 10, no. 6, 2017 (en ligne 2016), p. 582-603, open access, body of the article.
Open access open the source · checked on 9 September 2026
- ↑
Passage They merged it with the new one — assuming that the tilt of the axis brings one hemisphere closer to the Sun.
As students learn about the relevance of the tilt of the Earth's axis, they integrate this new idea with what they already believe by assuming that the tilt brings one hemisphere closer to the Sun than the other.
Source Bekaert, Hans, Van Winckel, Hans, Van Dooren, Wim, Steegen, An and De Cock, Mieke, “Design and Validation of an Instrument to Test Students’ Understanding of the Apparent Motion of the Sun and Stars”, Physical Review Physics Education Research, vol. 16, 020135, 2020, open access, body of the article.
Open access open the source · checked on 9 September 2026
- ↑
Passage Some accepted the new idea. Some blended the two. Some reverted entirely to the old one.
the students would often let go of them and accept the new ideas they were being taught, but would occasionally try to blend the old and new ideas or revert to the old ideas entirely
Source Science Education Resource Center (SERC), Carleton College, notice “A Private Universe” (description du film de Matthew H. Schneps et Philip M. Sadler), film description, SERC record (Carleton College).
Open access open the source · checked on 9 September 2026
- ↑
Passage the World Meteorological Organization (WMO) averages measurements over thirty years
Averages of climatological data computed for the following consecutive periods of 30 years: 1 January 1981–31 December 2010, 1 January 1991–31 December 2020, and so forth.
Source Organisation météorologique mondiale, WMO Guidelines on the Calculation of Climate Normals, OMM-N° 1203, Genève, 2017, section 3 “Definitions”, p. 2, definition of standard climatological normals.
Open access open the source · checked on 9 September 2026
- ↑
Passage […] when the rule was set, only thirty years of data were available to summarise
The 30-year period of reference was set as a standard mainly because only 30 years of data were available for summarization when the recommendation was first made.
Source Organisation météorologique mondiale, WMO Guidelines on the Calculation of Climate Normals, OMM-N° 1203, Genève, 2017, section 2 “Background”, p. 1.
Open access open the source · checked on 9 September 2026
- ↑
Passage rolling thirty-year reference periods, revised every ten years
Climatological standard normals. Averages of climatological data computed for the following consecutive periods of 30 years: 1 January 1981–31 December 2010, 1 January 1991–31 December 2020, and so forth. […] it has been decided that these should be updated every 10 years, with the next update due after the end of 2020.
Source Organisation météorologique mondiale, WMO Guidelines on the Calculation of Climate Normals, OMM-N° 1203, Genève, 2017, Section 3 “Definitions”, p. 2; section 5.1, p. 15.
Open access open the source · checked on 24 October 2026
- ↑
Passage The most widely used climate classification (Köppen-Geiger) divides the world according to temperature and precipitation.
The climate classification based on the work of Wladimir Köppen, and dating from 1900, continues to be the most widely used climate classification over a century later. […] the precipitation and temperature based variables used in the criteria to determine the Köppen-Geiger climate type […]
Source Peel, Murray C., Finlayson, Brian L. and McMahon, Thomas A., “Updated World Map of the Köppen-Geiger Climate Classification”, Hydrology and Earth System Sciences, vol. 11, 2007, p. 1633-1644, p. 1633, “1 Introduction”, 1st sentence; p. 1636, § 2 (“Data and methodology”).
Open access open the source · checked on 27 October 2026
- ↑
Passage the threshold for the temperature of the coldest month ranges between 0 °C and -3 °C depending on the author
We have followed Russell (1931) and used the temperature of the coldest month >0 °C, rather than >–3 °C as used by Köppen in defining the temperate – cold climate boundary (see Wilcox, 1968 and Essenwanger, 2001 for a history of this modification).
Source Peel, Murray C., Finlayson, Brian L. and McMahon, Thomas A., “Updated World Map of the Köppen-Geiger Climate Classification”, Hydrology and Earth System Sciences, vol. 11, 2007, p. 1633-1644, section 2 “Data and methodology”, p. 1635.
Open access · checked on 24 October 2026
- ↑
Passage Historical maps covering the period 1901-2010 show that many regions of the world changed climate category at least once
This work used a global temperature and precipitation observation dataset to reveal variations and changes of climate over the period 1901–2010 […] Otherwise this grid point is taken as having varying climates on a given time scale since it contains more than one climate type over the time period considered. […] On the interannual, interdecadal, and 30 year time scales, the climate type for a given grid may shift from one type to another
Source Chen, Deliang and Chen, Hans Weiteng, “Using the Köppen Classification to Quantify Climate Variation and Change: An Example for 1901–2010”, Environmental Development, vol. 6, 2013, p. 69-79, abstract; section 3 (Results and Discussions, Fig. 2 and Table 2); section 4 (Conclusions).
Open access open the source · checked on 25 October 2026
Bibliography
12
- Bekaert, Hans, Van Winckel, Hans, Van Dooren, Wim, Steegen, An and De Cock, Mieke, “Design and Validation of an Instrument to Test Students’ Understanding of the Apparent Motion of the Sun and Stars”, Physical Review Physics Education Research, vol. 16, 020135, 2020, open access (the persistent misconception and its merging with the tilt explanation). https://arxiv.org/pdf/2011.11308
- Chen, Deliang and Chen, Hans Weiteng, “Using the Köppen Classification to Quantify Climate Variation and Change: An Example for 1901–2010”, Environmental Development, vol. 6, 2013, p. 69-79, paywalled, authors’ copy open access (the 1901-2010 maps and the regions that changed climate type at least once). https://hanschen.org/wp/wp-content/uploads/chen-2013-ed.pdf
- De Paor, Declan G., Dordevic, Mladen M., Karabinos, Paul M., Burgin, Stephen R., Coba, Filis and Whitmeyer, Steven J., “Exploring the Reasons for the Seasons Using Google Earth, 3D Models, and Plots”, International Journal of Digital Earth, vol. 10, no. 6, 2017 (en ligne 2016), p. 582-603, open access (the 21 out of 23 people questioned; the attribution of the seasons to distance from the Sun; the asymmetry of authority between the elliptical orbit and the tilt). https://doi.org/10.1080/17538947.2016.1239770
- Gillmann, Cedric, Arney, Giada N., Avice, Guillaume, Dyar, M. Darby, Golabek, Gregor J., Gülcher, Anna J. P., Johnson, Natasha M., Lefevre, Maxence and Widemann, Thomas, “Venus”, preprint arXiv:2404.07669, 2024, open access (a uniform surface temperature between day and night, and small variations with latitude in the lower atmosphere). https://arxiv.org/abs/2404.07669
- Köppen, Wladimir and Geiger, Rudolf (ed.), Handbuch der Klimatologie, Gebrüder Borntraeger, Berlin, 1930-1939, in libraries.
- Organisation météorologique mondiale, WMO Guidelines on the Calculation of Climate Normals, OMM-N° 1203, Genève, 2017, open access (normals calculated over thirty years; the rule set because only thirty years of data were then available). https://www.ncei.noaa.gov/pub/data/normals/WMO/Guidelines%20for%20the%20Calculation%20of%20Climate%20Normals.WMO%20No1203_en.pdf
- Organisation météorologique mondiale, WMO Guidelines on the Calculation of Climate Normals, OMM-N° 1203, Genève, 2017, open access (the rolling periods revised every ten years).
- Organisation météorologique mondiale, Guide to Climatological Practices, OMM-N° 100, Genève, 2018, open access.
- Peel, Murray C., Finlayson, Brian L. and McMahon, Thomas A., “Updated World Map of the Köppen-Geiger Climate Classification”, Hydrology and Earth System Sciences, vol. 11, 2007, p. 1633-1644, open access (thresholds varying between versions, from 0 °C to −3 °C for the boundary between temperate and continental).
- Science Education Resource Center (SERC), Carleton College, notice “A Private Universe” (description du film), open access (the pupils who accept the new idea, blend the two or revert to the old one). https://serc.carleton.edu/resources/1672.html
- StarChild Team, NASA Goddard Space Flight Center (HEASARC), “When is Earth closest to the Sun?”, StarChild, open access (in January, the sunlight received by the Earth is about 7% more intense than in July, because of its slightly elliptical orbit). https://starchild.gsfc.nasa.gov/docs/StarChild/questions/question53.html
- Williams, David R., “Planetary Fact Sheet – Metric”, NASA Goddard Space Flight Center (NSSDCA), updated 18 March 2025, open access (the obliquity of the Earth’s axis of rotation to its orbit: 23.4°). https://nssdc.gsfc.nasa.gov/planetary/factsheet/
Spotted an error or have a doubt? Write to us.