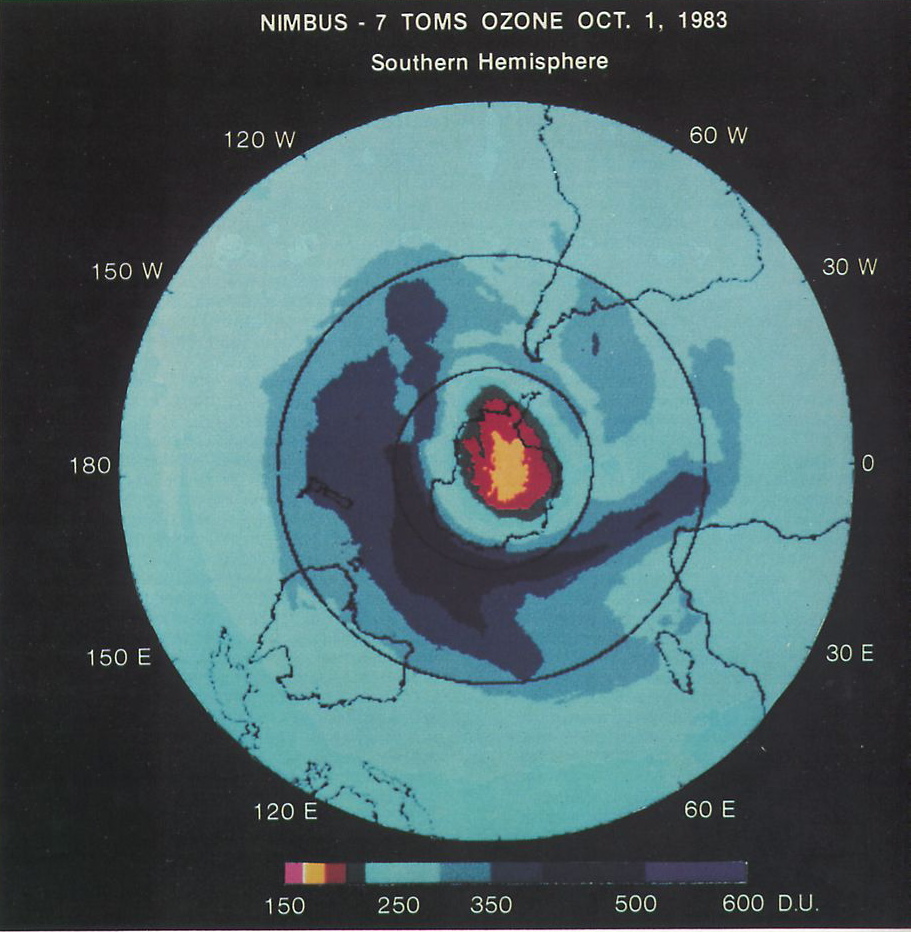

A global problem of the atmosphere has already been solved once. We know why, because we measured it.
This page tells how. It also tells why this does not carry over directly to the problem of the climate.
Protecting, and changing the system
Two very different approaches hide behind the word “ecology”, and confusing them prevents us from understanding what works.
To protect is to shelter. A protected area is marked out — national park, reserve, marine zone — where certain activities are banned or regulated. Threatened species are listed and placed off limits. Damaged environments are restored: replanting a forest, reopening the course of a river, reintroducing a species that has disappeared locally.
This approach has measurable results. It also has a structural limit: the whole planet cannot be turned into a reserve, and a protected area offers no protection against anything that comes from the atmosphere or the ocean — neither warming, nor acidification, nor pollutants carried by the wind.
The transition means changing the way we produce and consume, everywhere and not only in the reserved areas. It works through four levers.
- Energy. Replacing coal, oil and gas — whose combustion releases the carbon dioxide accumulated underground over millions of years — with sources that emit little or none of it: solar, wind, hydropower, nuclear, geothermal. These sources are called renewable when they replenish themselves on a human timescale.
- Materials. Making things with less, repairing, reusing, recycling — rather than extracting, using once, throwing away.
- Land. Feeding eight billion people while clearing less land and degrading soils less.
- Demand itself. Consuming less energy and material, which is called sufficiency. It is the most debated lever, because the other three are technical and this one is not.
None of these levers is enough on its own, and they cannot substitute for one another. An electric car settles the question of fuel, but not that of the metals that must be extracted for its battery, nor that of the space it takes up.
The difference in scale between the two approaches is essential, because it is the subject of this page. Protecting the ozone layer required replacing a handful of gases, made by a small number of companies and used in a few industries. The climate transition requires transforming the entire global energy system, after two centuries of development built on fossil fuels.
And there is a difference in cost, not only in scale. For the ozone layer, known replacement products could do the same job as the banned gases, and the decision could be taken at limited cost. For the climate, the political calculations are far more complicated and the sums at stake far higher.1
The first problem has been solved; that is no reason to believe that the second will be solved in the same way.
The recovery, with its dates
Our page on the atmosphere (7.7) describes in detail the discovery of the hole in the ozone layer in 1985 and the signing of the Montreal Protocol in 1987.
Observations now make it possible to establish the following.
The 2022 scientific assessment carried out by the WMO and UNEP indicates that, if current policies are maintained, ozone will return to its 1980 values:
- Around 2040 for the near-global average;
- Around 2045 above the Arctic;
- Around 2066 above the Antarctic.2
In addition, the total amount of chlorine in the lower atmosphere was, in 2020, about 12% lower than its 1993 peak.3
These dates come from a report published every four years. We cite the 2022 edition; the next is announced for the end of 2026. Whenever you see the phrase “the most recent assessment”, always check what year it dates from — this is true here as everywhere else on this site.4
The caveat, stated in the report itself
One feature makes this scientific assessment sound and directly citable.
Outside the Antarctic region, the authors themselves describe the evidence of recovery as limited and held with a low level of confidence.5
They do not merely announce an overall result. They state, point by point, the degree of certainty that can be attached to it — and they explicitly flag where the data remain fragile.
A piece of scientific work that sets out its own limits is more reliable, not less.
What did not work — and how we found out
After 2012, the decline of one of these banned gases — CFC-11 — slowed for no known reason.6
No state had reported any renewed increase in its production.7
It was direct measurement of the air that revealed the anomaly. At observation stations spread across the globe, the composition of the atmosphere is recorded continuously. The data no longer matched the official declarations: the air contained more of the gas than legal production could account for.
How a clandestine source is tracked down from an island
The approach is remarkable, and it comes down to three steps.
One. Very frequent measurements are available from two stations: one at Gosan, in South Korea, the other at Hateruma, in Japan.8
Two. When the wind comes from a certain direction, the concentration rises. By cross-referencing these peaks with models of air circulation — which calculate where the air mass arriving at the station came from — the region of origin is traced back.9
Three. The calculation points to eastern mainland China, and more precisely the area around two northeastern provinces. Emissions there exceed those of the previous period by about seven thousand tonnes a year.10
This excess represents at least 40 to 60% of the global rise.11
There remains a step that most accounts leave out: the authors also looked elsewhere. They found no significant increase in the other countries of East Asia or in any other region of the world where the data made it possible to detect one.12
Finding a cause is not enough. One must check that there are no others. Rumford had done the same with his cannon shavings two centuries earlier.
The 2022 assessment estimates that this unreported production, from 2012 to 2019, delays the return of polar ozone to its 1980 level by at most three years.13
The impact of the controls
From 2018 to 2019, global emissions of this gas fell by about a quarter: 26%, give or take 9 points. In eastern China, they fell by about ten thousand tonnes a year compared with 2014-2017, returning in 2019 to their pre-2013 level.14
In 2019, global emissions returned to a level close to their 2008-2012 average.15
Announced vs implemented: two notions to distinguish
To assess public policies for the ecological transition, a simple interpretive framework is called for.
A measure that has been announced is not a measure that has been implemented.
Between the political decision and the result on the ground come several key steps: drafting the texts, passing the law, publishing the implementing decrees, allocating the budget, setting up inspections, and implementation deadlines. Each of these steps can alter the scope of a measure, delay it or render it ineffective.
Why this distinction is essential
Target data and outcome data are often described in the same words.
When a publication mentions that a state “has decided to reduce its emissions by X%”, one should check whether this is a political target or a reduction actually measured.
- A target is decreed.
- A reduction is measured.
The three checking questions
Faced with any claim about the ecological transition, three methodological checks are enough:
- Is it a target or an observation? Any future deadline denotes a target.
- What is the reference year? A 30% reduction calculated relative to 1990 does not represent the same effort as a 30% fall calculated relative to 2015. A percentage means something only in relation to its starting point.
- What is the scope being counted? Are these territorial emissions (produced on national soil) or the carbon footprint (including emissions linked to imported products)? Both indicators are valid, but they can move in opposite directions for the same country.
Why the ozone model does not carry over to the climate
It would be inaccurate to conclude that the management of climate change will follow the same trajectory as that of ozone-depleting gases.
Three structural characteristics fundamentally set these two issues apart:
| Criterion | The ozone problem (1987) | The climate problem (today) |
|---|---|---|
| Diversity of substances | A limited family of industrial gases (CFCs, halons). | Many gases (CO₂, CH₄, N₂O) linked to almost all human activities. |
| Number of actors | A small number of chemical companies and producing countries. | Billions of emission sources (transport, energy, agriculture, industry). |
| Technical alternatives | Existing industrial substitutes that could be rapidly deployed. | Requires structural transformations of the entire production and energy system. |
Sources for the table16
These differences do not indicate a technical impossibility, but they confirm that the two problems do not involve the same scales or the same levers of action.
Note 1
present policymakers with an immediate alternative […] ozone depletion could be agreed and acted on with limited costs and limited complications […] politics were a lot simpler, and the sums of money involved much smaller
Hope, Mat, “Why We May Never Get a Montreal Protocol for Climate Change”, Carbon Brief, 12 September 2014
Note 2
around 2040 for the near-global average (60°N–60°S) […] around 2045 in the Arctic […] around 2066 in the Antarctic
Organisation météorologique mondiale and Programme des Nations unies pour l’environnement, Scientific Assessment of Ozone Depletion: 2022, rapport GAW no. 278, Genève, 2022
Note 3
12% lower than its peak value in 1993
Organisation météorologique mondiale and Programme des Nations unies pour l’environnement, Scientific Assessment of Ozone Depletion: 2022, rapport GAW no. 278, Genève, 2022
Note 4
which will be released at the end of 2026
NOAA Chemical Sciences Laboratory, “Scientific Assessment of Ozone Depletion: 2026”, page de présentation de l’évaluation
Note 5
the limited evidence of TCO recovery since 1996 has low confidence
Organisation météorologique mondiale and Programme des Nations unies pour l’environnement, Scientific Assessment of Ozone Depletion: 2022, rapport GAW no. 278, Genève, 2022
Note 6
A recently reported slowdown in the decline of the atmospheric concentration of CFC-11 after 2012, however, suggests that global emissions have increased. A concurrent increase in CFC-11 emissions from eastern Asia contributes to the global emission increase, but the location and magnitude of this regional source are unknown.
Rigby, Matthew et al., “Increase in CFC-11 Emissions from Eastern China Based on Atmospheric Observations”, Nature, vol. 569, 2019, p. 546-550
Note 7
A simple model analysis of our findings suggests an increase in CFC-11 emissions of 13 ± 5 gigagrams per year (25 ± 13 per cent) since 2012, despite reported production being close to zero since 2006. […] The increase in emission of CFC-11 appears unrelated to past production; this suggests unreported new production, which is inconsistent with the Montreal Protocol agreement to phase out global CFC production by 2010.
Montzka, Stephen A. et al., “An Unexpected and Persistent Increase in Global Emissions of Ozone-Depleting CFC-11”, Nature, vol. 557, 2018, p. 413-417
Note 8
using high-frequency atmospheric observations from Gosan, South Korea, and Hateruma, Japan
Rigby, Matthew et al., “Increase in CFC-11 Emissions from Eastern China Based on Atmospheric Observations”, Nature, vol. 569, 2019, p. 546-550
Note 9
together with global monitoring data and atmospheric chemical transport model simulations, we investigate regional CFC-11 emissions from eastern Asia
Rigby, Matthew et al., “Increase in CFC-11 Emissions from Eastern China Based on Atmospheric Observations”, Nature, vol. 569, 2019, p. 546-550
Note 10
emissions from eastern mainland China are 7.0 ± 3.0 (±1 standard deviation) gigagrams per year higher in 2014–2017 than in 2008–2012, and that the increase in emissions arises primarily around the northeastern provinces of Shandong and Hebei
Rigby, Matthew et al., “Increase in CFC-11 Emissions from Eastern China Based on Atmospheric Observations”, Nature, vol. 569, 2019, p. 546-550
Note 11
This increase accounts for a substantial fraction (at least 40 to 60 per cent) of the global rise in CFC-11 emissions.
Rigby, Matthew et al., “Increase in CFC-11 Emissions from Eastern China Based on Atmospheric Observations”, Nature, vol. 569, 2019, p. 546-550
Note 12
We find no evidence for a significant increase in CFC-11 emissions from any other eastern Asian countries or other regions of the world where there are available data for the detection of regional emissions.
Rigby, Matthew et al., “Increase in CFC-11 Emissions from Eastern China Based on Atmospheric Observations”, Nature, vol. 569, 2019, p. 546-550
Note 13
delay polar ozone return to 1980 values by up to 3 years
Organisation météorologique mondiale and Programme des Nations unies pour l’environnement, Scientific Assessment of Ozone Depletion: 2022, rapport GAW no. 278, Genève, 2022
Note 14
decreased by 18 ± 6 gigagrams per year (26 ± 9 per cent; one standard deviation)
Montzka, Stephen A. et al., “A Decline in Global CFC-11 Emissions during 2018-2019”, Nature, vol. 590, 2021, p. 428-432
CFC-11 emissions returned to pre-2013 levels in 2019 (5.0 ± 1.0 gigagrams per year in 2019 […] decreasing by 10 ± 3 gigagrams per year since 2014–2017.
Park, Sunyoung, Western, Luke M., Saito, Takuya et al., “A Decline in Emissions of CFC-11 and Related Chemicals from Eastern China”, Nature, vol. 590, 2021, p. 433-437
Note 15
to a 2019 value (52 ± 10 gigagrams per year) that is similar to the 2008−2012 mean
Montzka, Stephen A. et al., “A Decline in Global CFC-11 Emissions during 2018-2019”, Nature, vol. 590, 2021, p. 428-432
Note 16
the relatively simple impact of emitting chlorofluorocarbons (CFCs) on the ozone layer […] present policymakers with an immediate alternative
Hope, Mat, “Why We May Never Get a Montreal Protocol for Climate Change”, Carbon Brief, 12 September 2014
Notes and sources
- ↑
Passage For the ozone layer, known replacement products could do the same job as the banned gases, and the decision could be taken at limited cost. For the climate, the political calculations are far more complicated and the sums at stake far higher.
present policymakers with an immediate alternative […] ozone depletion could be agreed and acted on with limited costs and limited complications […] politics were a lot simpler, and the sums of money involved much smaller
Source Hope, Mat, “Why We May Never Get a Montreal Protocol for Climate Change”, Carbon Brief, 12 September 2014, analysis of the differences between the two cases.
Open access open the source · checked on 24 October 2026
- ↑
Passage Around 2040 for the near-global average; […] Around 2045 above the Arctic; […] Around 2066 above the Antarctic.
around 2040 for the near-global average (60°N–60°S) […] around 2045 in the Arctic […] around 2066 in the Antarctic
Source Organisation météorologique mondiale and Programme des Nations unies pour l’environnement, Scientific Assessment of Ozone Depletion: 2022, rapport GAW no. 278, Genève, 2022, executive summary.
Open access open the source · checked on 24 October 2026
- ↑
Passage the total amount of chlorine in the lower atmosphere was, in 2020, about 12% lower than its 1993 peak
12% lower than its peak value in 1993
Source Organisation météorologique mondiale and Programme des Nations unies pour l’environnement, Scientific Assessment of Ozone Depletion: 2022, rapport GAW no. 278, Genève, 2022, executive summary (total tropospheric chlorine, 3220 ppt in 2020).
Open access open the source · checked on 24 October 2026
- ↑
Passage We cite the 2022 edition; the next is announced for the end of 2026.
which will be released at the end of 2026
Source NOAA Chemical Sciences Laboratory, “Scientific Assessment of Ozone Depletion: 2026”, page de présentation de l’évaluation, assessment timetable (main report).
Open access open the source · checked on 24 October 2026
- ↑
Passage the authors themselves describe the evidence of recovery as limited and held with a low level of confidence
the limited evidence of TCO recovery since 1996 has low confidence
Source Organisation météorologique mondiale and Programme des Nations unies pour l’environnement, Scientific Assessment of Ozone Depletion: 2022, rapport GAW no. 278, Genève, 2022, executive summary (outside the Antarctic).
Open access open the source · checked on 24 October 2026
- ↑
Passage After 2012, the decline of one of these banned gases — CFC-11 — slowed for no known reason.
A recently reported slowdown in the decline of the atmospheric concentration of CFC-11 after 2012, however, suggests that global emissions have increased. A concurrent increase in CFC-11 emissions from eastern Asia contributes to the global emission increase, but the location and magnitude of this regional source are unknown.
Source Rigby, Matthew et al., “Increase in CFC-11 Emissions from Eastern China Based on Atmospheric Observations”, Nature, vol. 569, 2019, p. 546-550, abstract.
Paywalled open the source · checked on 9 September 2026
- ↑
Passage No state had reported any renewed increase in its production.
A simple model analysis of our findings suggests an increase in CFC-11 emissions of 13 ± 5 gigagrams per year (25 ± 13 per cent) since 2012, despite reported production being close to zero since 2006. […] The increase in emission of CFC-11 appears unrelated to past production; this suggests unreported new production, which is inconsistent with the Montreal Protocol agreement to phase out global CFC production by 2010.
Source Montzka, Stephen A. et al., “An Unexpected and Persistent Increase in Global Emissions of Ozone-Depleting CFC-11”, Nature, vol. 557, 2018, p. 413-417, abstract.
Paywalled · checked on 25 October 2026
- ↑
Passage Very frequent measurements are available from two stations: one at Gosan, in South Korea, the other at Hateruma, in Japan
using high-frequency atmospheric observations from Gosan, South Korea, and Hateruma, Japan
Source Rigby, Matthew et al., “Increase in CFC-11 Emissions from Eastern China Based on Atmospheric Observations”, Nature, vol. 569, 2019, p. 546-550, abstract.
Paywalled open the source · checked on 9 September 2026
- ↑
Passage By cross-referencing these peaks with models of air circulation […] the region of origin is traced back
together with global monitoring data and atmospheric chemical transport model simulations, we investigate regional CFC-11 emissions from eastern Asia
Source Rigby, Matthew et al., “Increase in CFC-11 Emissions from Eastern China Based on Atmospheric Observations”, Nature, vol. 569, 2019, p. 546-550, abstract.
Paywalled open the source · checked on 9 September 2026
- ↑
Passage eastern mainland China, and more precisely the area around two northeastern provinces. Emissions there exceed those of the previous period by about seven thousand tonnes a year
emissions from eastern mainland China are 7.0 ± 3.0 (±1 standard deviation) gigagrams per year higher in 2014–2017 than in 2008–2012, and that the increase in emissions arises primarily around the northeastern provinces of Shandong and Hebei
Source Rigby, Matthew et al., “Increase in CFC-11 Emissions from Eastern China Based on Atmospheric Observations”, Nature, vol. 569, 2019, p. 546-550, abstract.
Paywalled open the source · checked on 9 September 2026
- ↑
Passage This excess represents at least 40 to 60% of the global rise.
This increase accounts for a substantial fraction (at least 40 to 60 per cent) of the global rise in CFC-11 emissions.
Source Rigby, Matthew et al., “Increase in CFC-11 Emissions from Eastern China Based on Atmospheric Observations”, Nature, vol. 569, 2019, p. 546-550, abstract.
Paywalled open the source · checked on 9 September 2026
- ↑
Passage no significant increase in the other countries of East Asia or in any other region of the world where the data made it possible to detect one
We find no evidence for a significant increase in CFC-11 emissions from any other eastern Asian countries or other regions of the world where there are available data for the detection of regional emissions.
Source Rigby, Matthew et al., “Increase in CFC-11 Emissions from Eastern China Based on Atmospheric Observations”, Nature, vol. 569, 2019, p. 546-550, abstract.
Paywalled open the source · checked on 9 September 2026
- ↑
Passage The 2022 assessment estimates that this unreported production, from 2012 to 2019, delays the return of polar ozone to its 1980 level by at most three years.
delay polar ozone return to 1980 values by up to 3 years
Source Organisation météorologique mondiale and Programme des Nations unies pour l’environnement, Scientific Assessment of Ozone Depletion: 2022, rapport GAW no. 278, Genève, 2022, executive summary (unreported CFC-11 production over 2012–2019).
Open access open the source · checked on 24 October 2026
- ↑
Passage From 2018 to 2019, global emissions of this gas fell by about a quarter: 26%, give or take 9 points.
decreased by 18 ± 6 gigagrams per year (26 ± 9 per cent; one standard deviation)
Source Montzka, Stephen A. et al., “A Decline in Global CFC-11 Emissions during 2018-2019”, Nature, vol. 590, 2021, p. 428-432, abstract.
Paywalled · checked on 24 October 2026
Passage In eastern China, they fell by about ten thousand tonnes a year compared with 2014-2017, returning in 2019 to their pre-2013 level.
CFC-11 emissions returned to pre-2013 levels in 2019 (5.0 ± 1.0 gigagrams per year in 2019 […] decreasing by 10 ± 3 gigagrams per year since 2014–2017.
Source Park, Sunyoung, Western, Luke M., Saito, Takuya et al., “A Decline in Emissions of CFC-11 and Related Chemicals from Eastern China”, Nature, vol. 590, 2021, p. 433-437, abstract.
Paywalled open the source · checked on 24 October 2026
- ↑
Passage In 2019, global emissions returned to a level close to their 2008-2012 average.
to a 2019 value (52 ± 10 gigagrams per year) that is similar to the 2008−2012 mean
Source Montzka, Stephen A. et al., “A Decline in Global CFC-11 Emissions during 2018-2019”, Nature, vol. 590, 2021, p. 428-432, abstract.
Paywalled · checked on 24 October 2026
- ↑
Passage A limited family of industrial gases […] A small number of chemical companies and producing countries […] Existing industrial substitutes
the relatively simple impact of emitting chlorofluorocarbons (CFCs) on the ozone layer […] present policymakers with an immediate alternative
Source Hope, Mat, “Why We May Never Get a Montreal Protocol for Climate Change”, Carbon Brief, 12 September 2014, comparison of the two cases.
Open access open the source · checked on 24 October 2026
Bibliography
7
- Hope, Mat, “Why We May Never Get a Montreal Protocol for Climate Change”, Carbon Brief, 12 September 2014, open access (the reasons why the ozone case does not carry over: a relatively simple impact, available substitutes, limited costs). https://www.carbonbrief.org/why-we-may-never-get-a-montreal-protocol-for-climate-change/
- Montzka, Stephen A. et al., “A Decline in Global CFC-11 Emissions during 2018-2019”, Nature, vol. 590, 2021, p. 428-432, paywalled (the fall of about 26% in global emissions between 2018 and 2019 and their return to a level close to the 2008-2012 average).
- Montzka, Stephen A. et al., “An Unexpected and Persistent Increase in Global Emissions of Ozone-Depleting CFC-11”, Nature, vol. 557, 2018, p. 413-417, paywalled (the detection of the slowdown after 2012 from the measuring stations, with no declared renewed increase).
- NOAA Chemical Sciences Laboratory, “Scientific Assessment of Ozone Depletion: 2026”, page de présentation de l’évaluation, open access (the timetable of the next assessment, in preparation). https://csl.noaa.gov/assessments/ozone/2026
- Organisation météorologique mondiale and Programme des Nations unies pour l’environnement, Scientific Assessment of Ozone Depletion: 2022, rapport GAW no. 278, Genève, 2022, open access (the recovery dates by region, the confidence levels stated by the authors, the decline of tropospheric chlorine since its peak, the effect of unreported CFC-11 production). https://digitallibrary.un.org/record/4000934/files/executivesummary.pdf
- Park, Sunyoung, Western, Luke M., Saito, Takuya et al., “A Decline in Emissions of CFC-11 and Related Chemicals from Eastern China”, Nature, vol. 590, 2021, p. 433-437, paywalled (the fall in emissions from eastern China after 2014-2017 and their return to the pre-2013 level). https://doi.org/10.1038/s41586-021-03277-w
- Rigby, Matthew et al., “Increase in CFC-11 Emissions from Eastern China Based on Atmospheric Observations”, Nature, vol. 569, 2019, p. 546-550, paywalled (the high-frequency measurements from Gosan and Hateruma combined with transport models; an excess of about 7,000 tonnes a year located in eastern mainland China, around two northeastern provinces; at least 40 to 60% of the global rise; the absence of any increase detected elsewhere). https://doi.org/10.1038/s41586-019-1193-4
Spotted an error or have a doubt? Write to us.