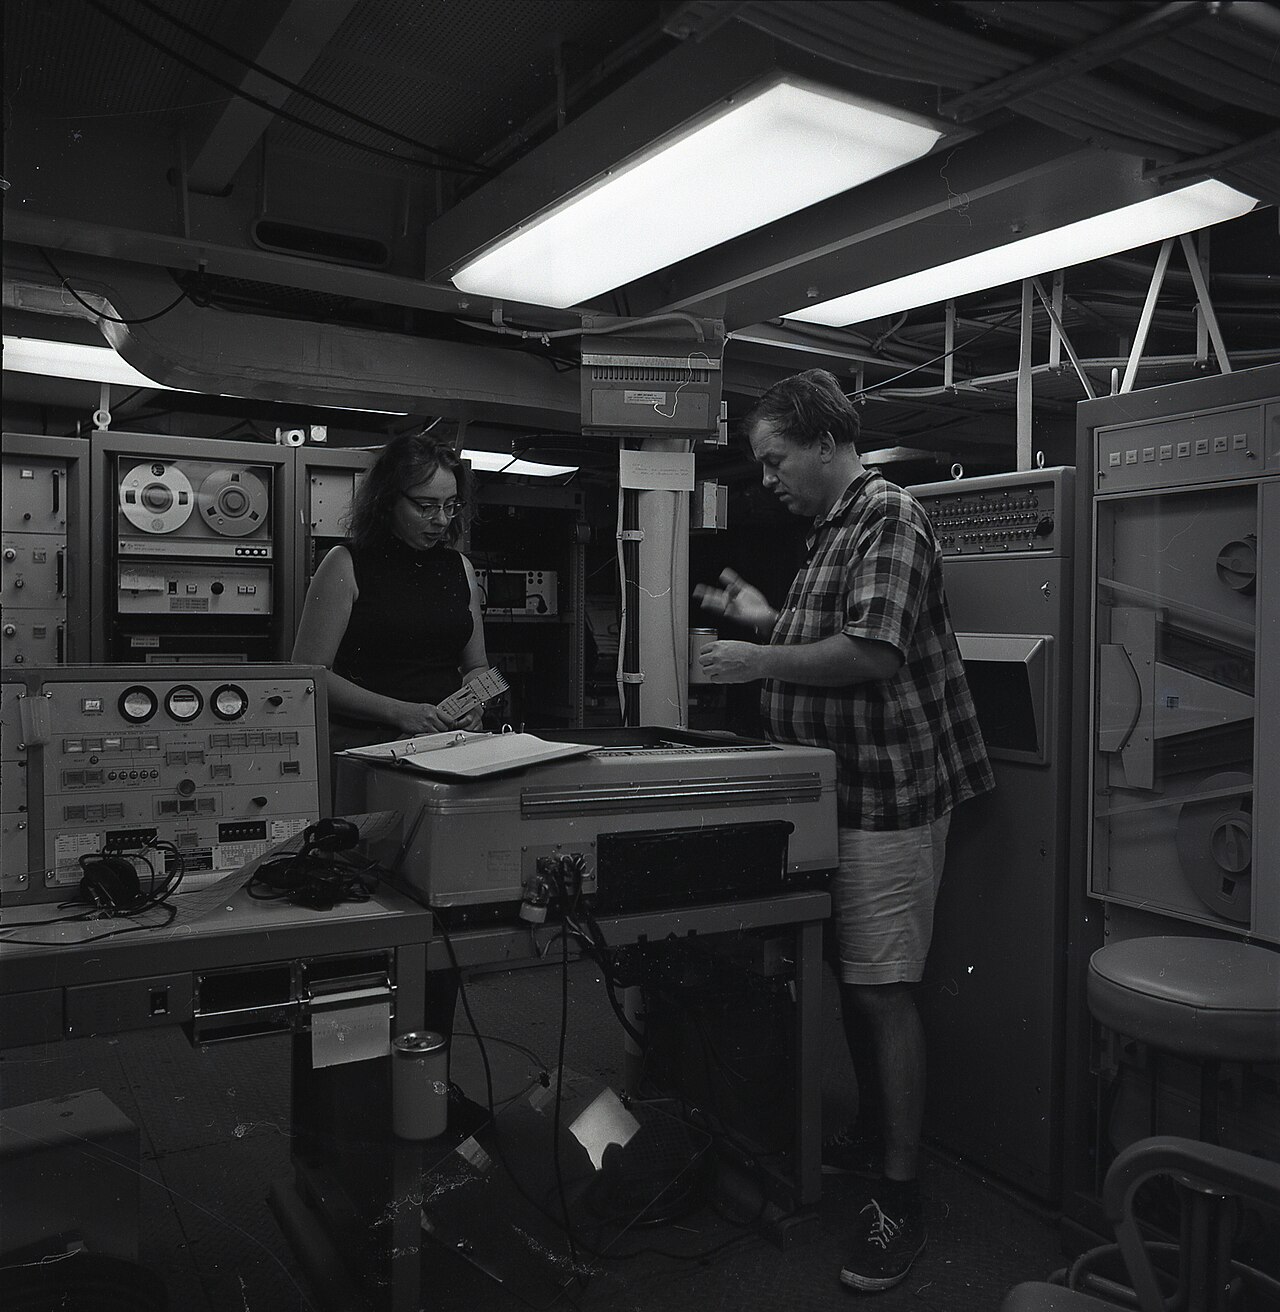

In 1952, a woman who was not allowed on board ship found, drawing by hand, the proof that the continents move.
Her superior called her interpretation “girl talk”.
Then he spent weeks trying to refute it. He did not succeed.
The plates and their movements
The Earth’s surface is not a single, unbroken shell. It is cracked into some fifteen large pieces, called plates, along with many smaller plates. These pieces float on a hotter, softer layer, and they move. The science that studies this division and these movements is called plate tectonics — from the Greek tektôn, the carpenter, the one who assembles.
Their thickness, though, has to be pictured correctly. A plate is between 5 and 100 kilometres thick and thousands of kilometres wide. Relative to the Earth, that is thinner than an eggshell.
The plates do not move fast: from less than three centimetres to more than fifteen centimetres a year, depending on the place. The slowest advance at roughly the speed at which fingernails grow. The Pacific Plate is the fastest, the Antarctic Plate one of the slowest. But they never stop, and over millions of years that is enough to open an ocean.1
Almost everything that moves on the Earth’s surface comes from this:
- Where two plates move apart, magma rises and makes new ocean floor. This is how the Atlantic widens by a few centimetres every year.
- Where two plates meet, one dives beneath the other or both crumple. This produces ocean trenches, volcanoes and mountain ranges: the Himalayas are the result of India pushing against Asia — it has travelled thousands of kilometres northwards, and the range is still rising by a few millimetres a year.
- Where two plates slide past each other, they catch, the strain builds, then gives way all at once. That is an earthquake. The San Andreas Fault, in California, is of this type.2
One point is essential before going any further: the continents do not wander across the oceans. It is the whole plates — sea floor included — that move, and the continents sit on top of them. This is precisely the story the rest of this page tells: the idea took half a century to be accepted, and the proof came from a map drawn by hand.
What was believed before
In 1912, Alfred Wegener proposed that the continents move. The American geological establishment rejected the idea for forty years.3
There are two reasons for this rejection, and both must be given:
- The first is scientific and legitimate: Wegener could not demonstrate by what mechanism continents could plough through the oceanic crust. He described a movement without being able to say what produced it.
- The second is not: he was a meteorologist. He was accused of encroaching on a field that was not his own.4
The historian Naomi Oreskes, however, disputes this account for the United States: in her view, drift was rejected there not for lack of a mechanism, but because it seemed to conflict with the standards of practice of American geology.5
Marie Tharp’s working conditions
She joined the Lamont Geological Observatory at Columbia University in 1948, as a draughtswoman.6
Because she was a woman, she was not allowed to go aboard the research ships. She would not go to sea for the first time until 1965 or 1968, depending on the source.7
Her male colleagues went to sea to take the soundings: echo measurements giving the depth beneath the ship, column after column of figures.
She stayed ashore and converted these columns into topographic profiles. By hand.
What she saw in 1952
While aligning six profiles of the floor of the North Atlantic — each profile being a cross-section of the ocean floor along a ship’s track — she noticed a constant: a V-shaped notch ran down the centre of the ocean relief.8
The decisive methodological detail, which she herself emphasised, is this: the individual mountains didn’t match up from one profile to the next. Only the notch coincided — especially in the three northernmost profiles.9
This point is crucial. She did not reach her conclusion because everything looked alike. She reached it because one single thing recurred amid everything else that varied.
She recognised it as a rift valley, comparable to the one in East Africa — a region where the land is pulling apart. But this one lay at the bottom of the ocean.10
She drew the key conclusion from it: the ocean floor is spreading apart. New crust forms along this notch and pushes away what lies on either side.
This was the mechanism Wegener had been missing for forty years.
The reaction and the cross-checking of data
She took her interpretation to Bruce Heezen, her superior. She reported his reaction as follows:
“When I showed what I found to Bruce, he groaned and said, ‘It cannot be. It looks too much like continental drift.’”11
She adds an explanation that is worth reading: at the time, believing in continental drift was almost a form of scientific heresy. Almost everyone in the United States thought it impossible.12
Then: “Bruce initially dismissed my interpretation of the profiles as ‘girl talk.’” He ordered her to recalculate everything and redraw everything.13
She started again. The valley was still there.14
This quotation is taken from a text written by Marie Tharp herself in 1999.
What tipped the balance was an independent cross-check. In the same laboratory, the epicentres of undersea earthquakes were being mapped for an entirely different purpose: the routing of transatlantic communications cables. When the two maps were overlaid at the same scale, the epicentres fell within the V-shaped notch.15
Two data sets, gathered for different reasons, that coincided. It took about six months for Heezen to be convinced.16
The sceptic who supplied the proof
What followed is even better.
At first, Jacques Cousteau did not believe in this valley. He set out to sea in the Atlantic, equipped with an underwater camera, intending to show that it did not exist.17
The images showed the cliffs of the valley.
He wanted to refute; he confirmed. That is the best thing that can happen to a hypothesis: someone who wants it to fail goes to check for himself, and reports the opposite.
The driving force and plate boundaries
How the plates interact
The Earth’s lithosphere is divided into rigid plates that interact at their boundaries in three ways:
| Type of boundary | Movement | Geological result |
|---|---|---|
| Divergent (e.g. ridge) | The plates move apart | Creation of oceanic crust (rift) |
| Convergent (e.g. subduction) | The plates move towards each other | One plate dives beneath the other or forms mountains |
| Transform (e.g. fault) | The plates slide sideways | Frequent earthquakes without creation/destruction of crust |
What makes the plates move?
For a long time, the dominant theory assumed that the plates were pushed by convection currents in the mantle, like rafts on water.
That explanation has changed. Today we know that the main force comes from the edge of the plates themselves: where a cold, dense oceanic plate sinks into the mantle (subduction), its own weight pulls it downwards and drags the rest of the plate along with it.18
It is not a push from below: it is a pull from the edge.
How fast do the continents move?
The order of magnitude was given above — a few centimetres a year. Accumulated over time, it adds up as follows.
- Over 80 years (the span of a lifetime): a few metres — at five centimetres a year, about four metres.
- Over 1 million years: a few tens of kilometres.
- Over 100 million years: the opening or closing of an ocean.19
Interactive
At the speed of the plates
The plates do not move fast: a few centimetres a year. But they never stop.
The question
A few centimetres a year: enough to open an ocean?

What you do Choose a speed, then let time pass: a year, a lifetime, a million years, a hundred million. Watch the distance travelled.
Without JavaScript, here are the animation’s data.
| Where | Speed | Source |
|---|---|---|
| Mid-Atlantic Ridge (average) | 2.5 cm a year | 1 |
| Pacific Plate against North American Plate (average) | 5 cm a year | 2 |
| The fastest | more than 15 cm a year | 3 |
| Time span | Speed | Distance |
|---|---|---|
| 80 years (a lifetime) | 5 cm a year | 4 m |
| 1 million years | 2.5 cm a year | 25 km |
The distances are calculated: speed multiplied by time, as if the plate always kept the same speed. The drawing of the plates is not to scale.
The takeaway A few centimetres a year is invisible over a lifetime. Over millions of years, it is enough to open an ocean.
Photo credits 3
- The relief of the South Atlantic floor, between South America and Africa (NOAA). NOAA, Public domain, source
- The breakup of Pangaea: the continents, at first joined, move apart to their present positions (United States Geological Survey, ’This Dynamic Earth’). Jacquelyne Kious and Robert I. Tilling (USGS), Public domain, source
- Blue Marble: Next Generation, with land topography and sea-floor bathymetry, in equirectangular projection: map produced by Reto Stöckli, NASA Earth Observatory (NASA Goddard Space Flight Center). Reto Stöckli, NASA Earth Observatory, modified by NordNordWest, Public domain, source


Sources 4
United States Geological Survey, This Dynamic Earth: The Story of Plate Tectonics, “Understanding plate motions” page (https://pubs.usgs.gov/gip/dynamic/understanding.html).
The rate of spreading along the Mid-Atlantic Ridge averages about 2.5 centimeters per year (cm/yr), or 25 km in a million years.
Open access open the source · checked on 24 October 2026
United States Geological Survey, This Dynamic Earth: The Story of Plate Tectonics, “Understanding plate motions” page, passage on the San Andreas Fault (https://pubs.usgs.gov/gip/dynamic/understanding.html).
Along it, the Pacific Plate has been grinding horizontally past the North American Plate for 10 million years, at an average rate of about 5 cm/yr.
Open access open the source · checked on 24 October 2026
United States Geological Survey, This Dynamic Earth: The Story of Plate Tectonics, “Historical perspective” page, 1st paragraph (https://pubs.usgs.gov/gip/dynamic/historical.html) […] “Understanding plate motions” page, part on divergent boundaries (https://pubs.usgs.gov/gip/dynamic/understanding.html).
The theory of plate tectonics states that the Earth's outermost layer is fragmented into a dozen or more large and small plates that are moving relative to one another as they ride atop hotter, more mobile material. […] The rate of spreading along the Mid-Atlantic Ridge averages about 2.5 centimeters per year (cm/yr), or 25 km in a million years. […] The Arctic Ridge has the slowest rate (less than 2.5 cm/yr), and the East Pacific Rise near Easter Island, in the South Pacific about 3,400 km west of Chile, has the fastest rate (more than 15 cm/yr).
Open access open the source · checked on 24 October 2026
United States Geological Survey, This Dynamic Earth: The Story of Plate Tectonics, “Understanding plate motions” page (https://pubs.usgs.gov/gip/dynamic/understanding.html), paragraphs on the types of boundary.
Divergent boundaries occur along spreading centers where plates are moving apart and new crust is created by magma pushing up from the mantle. […] Such destruction (recycling) of crust takes place along convergent boundaries where plates are moving toward each other, and sometimes one plate sinks (is subducted) under another. […] The zone between two plates sliding horizontally past one another is called a transform-fault boundary, or simply a transform boundary.
Open access open the source · checked on 24 October 2026
The word that remains
We still use the expression “continental drift”. This vocabulary dates from the time when it was believed that the continental masses slid directly over the ocean floor. The explanation has changed (it is whole plates that move), but the term has stayed.
The historical credit and what followed
The first results were presented in the mid-1950s. In keeping with the customs of the time, Bruce Heezen published the work as principal author and received a disproportionate share of the initial credit: the first published abstract does not mention Marie Tharp.20
In 1977, Tharp and Heezen published the first composite world map of the ocean floor, revealing an undersea mountain chain more than 60,000 km long.21
Marie Tharp’s role would be fully recognised later: she received the Hubbard Medal in 1978, and in 1997 the Library of Congress ranked her among the most important cartographers of the twentieth century.22
Note 1
The theory of plate tectonics states that the Earth's outermost layer is fragmented into a dozen or more large and small plates that are moving relative to one another as they ride atop hotter, more mobile material. […] The rate of spreading along the Mid-Atlantic Ridge averages about 2.5 centimeters per year (cm/yr), or 25 km in a million years. […] The Arctic Ridge has the slowest rate (less than 2.5 cm/yr), and the East Pacific Rise near Easter Island, in the South Pacific about 3,400 km west of Chile, has the fastest rate (more than 15 cm/yr).
United States Geological Survey, This Dynamic Earth: The Story of Plate Tectonics
Note 2
Divergent boundaries occur along spreading centers where plates are moving apart and new crust is created by magma pushing up from the mantle. […] Such destruction (recycling) of crust takes place along convergent boundaries where plates are moving toward each other, and sometimes one plate sinks (is subducted) under another. […] The zone between two plates sliding horizontally past one another is called a transform-fault boundary, or simply a transform boundary.
United States Geological Survey, This Dynamic Earth: The Story of Plate Tectonics
Note 3
Aus diesen Widersprüchen gibt es nur einen Ausweg: wenn wir annehmen, daß die Kontinentalschollen nicht nur in vertikaler Richtung zu isostatischen Ausgleichsbewegungen befähigt sind, sondern auch zu Bewegungen in horizontaler Richtung. […] 1912 erfolgten die ersten beiden Veröffentlichungen der Verschiebungstheorie […], denen 1915 die ausführlichere Darstellung in der ersten Auflage dieser Arbeit folgte.
There is only one way out of these contradictions: to assume that the continental blocks are capable not only of isostatic compensating movements in the vertical direction, but also of movements in the horizontal direction. […] In 1912 the first two publications of the displacement theory appeared, followed in 1915 by the fuller account in the first edition of this work.
Wegener, Alfred, Die Entstehung der Kontinente und Ozeane, 2nd, completely revised edition, Vieweg, Braunschweig, 1920
Note 4
A fatal weakness in Wegener's theory was that it could not satisfactorily answer the most fundamental question raised by his critics: What kind of forces could be strong enough to move such large masses of solid rock over such great distances? […] Despite overwhelming criticism from most leading geologists, who regarded him as a mere meteorologist and outsider meddling in their field
United States Geological Survey, This Dynamic Earth: The Story of Plate Tectonics
Note 5
Challenging previous historical work on this episode, Naomi Oreskes shows that continental drift was not rejected for the lack of a causal mechanism, but because it seemed to conflict with the basic standards of practice in American geology.
Oreskes, Naomi, The Rejection of Continental Drift: Theory and Method in American Earth Science, Oxford University Press, 1999
Note 6
Still searching for something more challenging, I went to New York in 1948. […] Finally he blurted out, "Can you draft?" I had had a part-time drafting job at Michigan, so he hired me.
Tharp, Marie, “Connect the Dots: Mapping the Seafloor and Discovering the Mid-ocean Ridge”, dans Lippsett, Laurence
Note 7
Heezen completed 33 cruises on the Vema without Tharp on board, because women were not allowed on the ship at the time. […] After 1965, when Tharp accompanied Heezen for the first time on Vema 34,
Evans, Rachel, “Plumbing Depths to Reach New Heights: Marie Tharp Explains Marine Geological Maps”, Library of Congress Information Bulletin, vol. 61, no. 11, November 2002
She didn't set foot on a research cruise until 1968.
Université Columbia, Faculté des arts et des sciences, “8 Surprising Facts About Marie Tharp”
Note 8
In 1952, as Tharp was aligning six sounding profiles running across the Atlantic, she noticed that all of profiles showed a V-shaped notch at the center of the mid-ocean ridge.
Université Columbia, Faculté des arts et des sciences, “8 Surprising Facts About Marie Tharp”
Note 9
The individual mountains didn't match up, but the cleft did, especially in the three northernmost profiles.
Tharp, Marie, “Connect the Dots: Mapping the Seafloor and Discovering the Mid-ocean Ridge”, dans Lippsett, Laurence (dir.), Lamont-Doherty Earth Observatory of Columbia: Twelve Perspectives on the First Fifty Years, 1999
Note 10
She thought the notch must be a rift valley — a place where the seafloor was spreading apart,
Université Columbia, Faculté des arts et des sciences, “8 Surprising Facts About Marie Tharp”
Note 11
When I showed what I found to Bruce, he groaned and said, “It cannot be. It looks too much like continental drift.”
Tharp, Marie, “Connect the Dots: Mapping the Seafloor and Discovering the Mid-ocean Ridge”, dans Lippsett, Laurence (dir.), Lamont-Doherty Earth Observatory of Columbia: Twelve Perspectives on the First Fifty Years, 1999
Note 12
At the time, believing in the theory of continental drift was almost a form of scientific heresy. Almost everyone in the United States thought continental drift was impossible.
Tharp, Marie, “Connect the Dots: Mapping the Seafloor and Discovering the Mid-ocean Ridge”, dans Lippsett, Laurence (dir.), Lamont-Doherty Earth Observatory of Columbia: Twelve Perspectives on the First Fifty Years, 1999
Note 13
Bruce initially dismissed my interpretation of the profiles as 'girl talk.'
Tharp, Marie, “Connect the Dots: Mapping the Seafloor and Discovering the Mid-ocean Ridge”, dans Lippsett, Laurence (dir.), Lamont-Doherty Earth Observatory of Columbia: Twelve Perspectives on the First Fifty Years, 1999
Note 14
Only after she re-drew the profiles twice and showed him that the valley's pattern correlated with newly mapped earthquake epicenters in the North Atlantic did he accept the valley's existence—a correlation that also allowed Tharp to extend the rift valley out of the Atlantic and across the entire world.
Felt, Hali, “Marie Tharp, Plate Tectonics Pioneer”, GSA Today, vol. 27, no. 6, June 2017, p. 32
Note 15
Meanwhile, Bruce began another project with Dr. Ewing to locate earthquake regions to avoid in the routing of transatlantic communications cables, assisted by Howard Foster. As Marie mapped the world’s seafloor, Howard sat nearby and mapped earthquake epicenters at the same scale.
EarthDate, “First Map of the Ocean Floor”, episode 286, Switch Energy Alliance, 19 October 2022
Of course, Beno Gutenberg and Charles Richter earlier had noticed that a belt of shallow earthquakes followed the ridge, but Bruce saw that the earthquakes fell within the rift valley.
Tharp, Marie, “Connect the Dots: Mapping the Seafloor and Discovering the Mid-ocean Ridge”, dans Lippsett, Laurence (dir.), Lamont-Doherty Earth Observatory of Columbia: Twelve Perspectives on the First Fifty Years, 1999
Note 16
It took half a year until Heezen was convinced
Université Columbia, Faculté des arts et des sciences, “8 Surprising Facts About Marie Tharp”
Note 17
The famous ocean explorer Jacques Cousteau didn't believe the rift valley really existed. So he set sail into the Atlantic with an underwater camera rig, intending to prove Tharp and Heezen wrong. In his photos and videos, displayed to a large crowd at the First International Oceanographic Congress in 1959, “the great black cliffs of the rift valley, sprinkled with white glob ooze, loomed up through the blue-green water,”
Université Columbia, Faculté des arts et des sciences, “8 Surprising Facts About Marie Tharp”
Like most scientists, Jacques Cousteau at first didn't believe in the rift valley. He crossed the Atlantic Ocean in the Calypso, towing a movie camera on a sled near the seafloor. […] He took beautiful movies of big black cliffs in blue water, which he showed at the first International Ocean Congress in New York in 1959.
Tharp, Marie, “Connect the Dots: Mapping the Seafloor and Discovering the Mid-ocean Ridge”, dans Lippsett, Laurence
Note 18
The gravity-controlled sinking of a cold, denser oceanic slab into the subduction zone (called "slab pull") -- dragging the rest of the plate along with it -- is now considered to be the driving force of plate tectonics.
United States Geological Survey, This Dynamic Earth: The Story of Plate Tectonics
Note 19
Along it, the Pacific Plate has been grinding horizontally past the North American Plate for 10 million years, at an average rate of about 5 cm/yr.
United States Geological Survey, This Dynamic Earth: The Story of Plate Tectonics
The rate of spreading along the Mid-Atlantic Ridge averages about 2.5 centimeters per year (cm/yr), or 25 km in a million years.
United States Geological Survey, This Dynamic Earth: The Story of Plate Tectonics
Note 20
another three years after that until the findings were published as an abstract — without crediting Tharp
Université Columbia, Faculté des arts et des sciences, “8 Surprising Facts About Marie Tharp”
In 1956, Ewing and Heezen showed the results of the Lamont work at an American Geophysical Union meeting in Toronto.
EarthDate, “First Map of the Ocean Floor”, episode 286, Switch Energy Alliance, 19 October 2022
Note 21
Over the course of 20 years, Tharp continued her partnership with Heezen, mapping the ocean floor and incorporating new sources of data as they emerged. In 1977, the team commissioned Austrian painter Heinrich Berann — famous for his Alpine panoramas — to hand-paint the world ocean floor map, the first realistic depiction of complete ocean-floor bathymetry.
Snow, Meagan and Pastuch, Carissa, “The Woman Who Mapped the Ocean”, Library of Congress Magazine, March-April 2026
The mountainous ridge was shown to run for 40,350 mi through the world’s oceans, like the stitching on a baseball. […] In the late 1960’s, she and Dr. Heezen collaborated with Austrian painter Heinrich Berann to produce colored physiographic maps of the Indian Ocean in 1967 and the world ocean in 1977.
EarthDate, “First Map of the Ocean Floor”, episode 286, Switch Energy Alliance, 19 October 2022
Note 22
1978: Marie Tharp
National Geographic Society, “Awards”, liste des lauréats de la médaille Hubbard (“Past Awardees”)
Tharp herself received an outstanding achievement award from the Society of Women Geographers in 1996, and the Library's Phillips Society honored her as one the 20th Century's Outstanding Cartographers in 1997.
Evans, Rachel, “Plumbing Depths to Reach New Heights: Marie Tharp Explains Marine Geological Maps”, Library of Congress Information Bulletin, vol. 61, no. 11, November 2002
Notes and sources
- ↑
Passage The Earth’s surface is not a single, unbroken shell. It is cracked into some fifteen large pieces […] The plates do not move fast: from less than three centimetres to more than fifteen centimetres a year, depending on the place
The theory of plate tectonics states that the Earth's outermost layer is fragmented into a dozen or more large and small plates that are moving relative to one another as they ride atop hotter, more mobile material. […] The rate of spreading along the Mid-Atlantic Ridge averages about 2.5 centimeters per year (cm/yr), or 25 km in a million years. […] The Arctic Ridge has the slowest rate (less than 2.5 cm/yr), and the East Pacific Rise near Easter Island, in the South Pacific about 3,400 km west of Chile, has the fastest rate (more than 15 cm/yr).
Source United States Geological Survey, This Dynamic Earth: The Story of Plate Tectonics, “Historical perspective” page, 1st paragraph (https://pubs.usgs.gov/gip/dynamic/historical.html) […] “Understanding plate motions” page, part on divergent boundaries (https://pubs.usgs.gov/gip/dynamic/understanding.html).
Open access open the source · checked on 24 October 2026
- ↑
Passage Where two plates move apart, magma rises […] Where two plates meet, one dives beneath the other […] Where two plates slide past each other
Divergent boundaries occur along spreading centers where plates are moving apart and new crust is created by magma pushing up from the mantle. […] Such destruction (recycling) of crust takes place along convergent boundaries where plates are moving toward each other, and sometimes one plate sinks (is subducted) under another. […] The zone between two plates sliding horizontally past one another is called a transform-fault boundary, or simply a transform boundary.
Source United States Geological Survey, This Dynamic Earth: The Story of Plate Tectonics, “Understanding plate motions” page (https://pubs.usgs.gov/gip/dynamic/understanding.html), paragraphs on the types of boundary.
Open access open the source · checked on 24 October 2026
- ↑
Passage In 1912, Alfred Wegener proposed that the continents move.
Aus diesen Widersprüchen gibt es nur einen Ausweg: wenn wir annehmen, daß die Kontinentalschollen nicht nur in vertikaler Richtung zu isostatischen Ausgleichsbewegungen befähigt sind, sondern auch zu Bewegungen in horizontaler Richtung. […] 1912 erfolgten die ersten beiden Veröffentlichungen der Verschiebungstheorie […], denen 1915 die ausführlichere Darstellung in der ersten Auflage dieser Arbeit folgte.
Editors’ translation There is only one way out of these contradictions: to assume that the continental blocks are capable not only of isostatic compensating movements in the vertical direction, but also of movements in the horizontal direction. […] In 1912 the first two publications of the displacement theory appeared, followed in 1915 by the fuller account in the first edition of this work.
Source Wegener, Alfred, Die Entstehung der Kontinente und Ozeane, 2nd, completely revised edition, Vieweg, Braunschweig, 1920, chapter 1, p. 10 and p. 13.
Public domain open the source · checked on 27 October 2026
- ↑
Passage Wegener could not demonstrate by what mechanism […] he was a meteorologist. He was accused of encroaching on a field that was not his own.
A fatal weakness in Wegener's theory was that it could not satisfactorily answer the most fundamental question raised by his critics: What kind of forces could be strong enough to move such large masses of solid rock over such great distances? […] Despite overwhelming criticism from most leading geologists, who regarded him as a mere meteorologist and outsider meddling in their field
Source United States Geological Survey, This Dynamic Earth: The Story of Plate Tectonics, section “Historical perspective”; section “Alfred Lothar Wegener”.
Open access open the source 1 open the source 2 · checked on 27 October 2026
- ↑
Passage The historian Naomi Oreskes, however, disputes this account for the United States: in her view, drift was rejected there not for lack of a mechanism, but because it seemed to conflict with the standards of practice of American geology.
Challenging previous historical work on this episode, Naomi Oreskes shows that continental drift was not rejected for the lack of a causal mechanism, but because it seemed to conflict with the basic standards of practice in American geology.
Source Oreskes, Naomi, The Rejection of Continental Drift: Theory and Method in American Earth Science, Oxford University Press, 1999, description of the book, Department of the History of Science, Harvard University.
In libraries; description open access open the source · checked on 27 October 2026
- ↑
Passage She joined the Lamont Geological Observatory at Columbia University
Still searching for something more challenging, I went to New York in 1948. […] Finally he blurted out, "Can you draft?" I had had a part-time drafting job at Michigan, so he hired me.
Source Tharp, Marie, “Connect the Dots: Mapping the Seafloor and Discovering the Mid-ocean Ridge”, dans Lippsett, Laurence, beginning of the autobiographical account (arrival in New York and hiring by Maurice Ewing at Columbia).
Open access open the source · checked on 24 October 2026
- ↑
Passage Because she was a woman, she was not allowed to go aboard the research ships. She would not go to sea for the first time until 1965 or 1968, depending on the source.
Heezen completed 33 cruises on the Vema without Tharp on board, because women were not allowed on the ship at the time. […] After 1965, when Tharp accompanied Heezen for the first time on Vema 34,
Source Evans, Rachel, “Plumbing Depths to Reach New Heights: Marie Tharp Explains Marine Geological Maps”, Library of Congress Information Bulletin, vol. 61, no. 11, November 2002, body of the article.
Open access open the source · checked on 27 October 2026
Passage She would not go to sea for the first time until 1965 or 1968, depending on the source.
She didn't set foot on a research cruise until 1968.
Source Université Columbia, Faculté des arts et des sciences, “8 Surprising Facts About Marie Tharp”, body of the article.
Open access open the source · checked on 27 October 2026
- ↑
Passage While aligning six profiles of the floor of the North Atlantic
In 1952, as Tharp was aligning six sounding profiles running across the Atlantic, she noticed that all of profiles showed a V-shaped notch at the center of the mid-ocean ridge.
Source Université Columbia, Faculté des arts et des sciences, “8 Surprising Facts About Marie Tharp”, point 3 of the article.
Open access open the source · checked on 9 September 2026
- ↑
Passage the individual mountains didn’t match up from one profile to the next. Only the notch coincided — especially in the three northernmost profiles.
The individual mountains didn't match up, but the cleft did, especially in the three northernmost profiles.
Source Tharp, Marie, “Connect the Dots: Mapping the Seafloor and Discovering the Mid-ocean Ridge”, dans Lippsett, Laurence (dir.), Lamont-Doherty Earth Observatory of Columbia: Twelve Perspectives on the First Fifty Years, 1999, quotation from Marie Tharp.
Open access open the source · checked on 9 September 2026
- ↑
Passage She recognised it as a rift valley […] the ocean floor is spreading apart
She thought the notch must be a rift valley — a place where the seafloor was spreading apart,
Source Université Columbia, Faculté des arts et des sciences, “8 Surprising Facts About Marie Tharp”, point 3 of the article.
Open access open the source · checked on 9 September 2026
- ↑
Passage When I showed what I found to Bruce, he groaned and said, ‘It cannot be. It looks too much like continental drift.’
When I showed what I found to Bruce, he groaned and said, “It cannot be. It looks too much like continental drift.”
Source Tharp, Marie, “Connect the Dots: Mapping the Seafloor and Discovering the Mid-ocean Ridge”, dans Lippsett, Laurence (dir.), Lamont-Doherty Earth Observatory of Columbia: Twelve Perspectives on the First Fifty Years, 1999, Marie Tharp’s account.
Open access open the source · checked on 9 September 2026
- ↑
Passage at the time, believing in continental drift was almost a form of scientific heresy. Almost everyone in the United States thought it impossible.
At the time, believing in the theory of continental drift was almost a form of scientific heresy. Almost everyone in the United States thought continental drift was impossible.
Source Tharp, Marie, “Connect the Dots: Mapping the Seafloor and Discovering the Mid-ocean Ridge”, dans Lippsett, Laurence (dir.), Lamont-Doherty Earth Observatory of Columbia: Twelve Perspectives on the First Fifty Years, 1999, Marie Tharp’s account.
Open access open the source · checked on 9 September 2026
- ↑
Passage Bruce initially dismissed my interpretation of the profiles as ‘girl talk.’
Bruce initially dismissed my interpretation of the profiles as 'girl talk.'
Source Tharp, Marie, “Connect the Dots: Mapping the Seafloor and Discovering the Mid-ocean Ridge”, dans Lippsett, Laurence (dir.), Lamont-Doherty Earth Observatory of Columbia: Twelve Perspectives on the First Fifty Years, 1999, Marie Tharp’s account.
Open access open the source · checked on 9 September 2026
- ↑
Passage She started again. The valley was still there.
Only after she re-drew the profiles twice and showed him that the valley's pattern correlated with newly mapped earthquake epicenters in the North Atlantic did he accept the valley's existence—a correlation that also allowed Tharp to extend the rift valley out of the Atlantic and across the entire world.
Source Felt, Hali, “Marie Tharp, Plate Tectonics Pioneer”, GSA Today, vol. 27, no. 6, June 2017, p. 32, p. 33, section “Discoveries and Impact”, 2nd paragraph.
Open access open the source · checked on 9 September 2026
- ↑
Passage the epicentres of undersea earthquakes were being mapped for an entirely different purpose: the routing of transatlantic communications cables
Meanwhile, Bruce began another project with Dr. Ewing to locate earthquake regions to avoid in the routing of transatlantic communications cables, assisted by Howard Foster. As Marie mapped the world’s seafloor, Howard sat nearby and mapped earthquake epicenters at the same scale.
Source EarthDate, “First Map of the Ocean Floor”, episode 286, Switch Energy Alliance, 19 October 2022, episode “Background” text, bullet and sub-bullet on Heezen and Ewing’s project.
Open access open the source · checked on 27 October 2026
Passage the epicentres fell within the V-shaped notch
Of course, Beno Gutenberg and Charles Richter earlier had noticed that a belt of shallow earthquakes followed the ridge, but Bruce saw that the earthquakes fell within the rift valley.
Source Tharp, Marie, “Connect the Dots: Mapping the Seafloor and Discovering the Mid-ocean Ridge”, dans Lippsett, Laurence (dir.), Lamont-Doherty Earth Observatory of Columbia: Twelve Perspectives on the First Fifty Years, 1999, Marie Tharp’s account.
Open access open the source · checked on 9 September 2026
- ↑
Passage It took about six months for Heezen to be convinced.
It took half a year until Heezen was convinced
Source Université Columbia, Faculté des arts et des sciences, “8 Surprising Facts About Marie Tharp”, point 3 of the article.
Open access open the source · checked on 9 September 2026
- ↑
Passage Jacques Cousteau did not believe in this valley. He set out to sea in the Atlantic, equipped with an underwater camera, intending to show that it did not exist. […] The images showed the cliffs of the valley.
The famous ocean explorer Jacques Cousteau didn't believe the rift valley really existed. So he set sail into the Atlantic with an underwater camera rig, intending to prove Tharp and Heezen wrong. In his photos and videos, displayed to a large crowd at the First International Oceanographic Congress in 1959, “the great black cliffs of the rift valley, sprinkled with white glob ooze, loomed up through the blue-green water,”
Source Université Columbia, Faculté des arts et des sciences, “8 Surprising Facts About Marie Tharp”, point 4 of the article.
Open access open the source · checked on 9 September 2026
Passage At first, Jacques Cousteau did not believe in this valley
Like most scientists, Jacques Cousteau at first didn't believe in the rift valley. He crossed the Atlantic Ocean in the Calypso, towing a movie camera on a sled near the seafloor. […] He took beautiful movies of big black cliffs in blue water, which he showed at the first International Ocean Congress in New York in 1959.
Source Tharp, Marie, “Connect the Dots: Mapping the Seafloor and Discovering the Mid-ocean Ridge”, dans Lippsett, Laurence, passage on the confirmation of the rift valley (Cousteau episode).
Open access open the source · checked on 24 October 2026
- ↑
Passage its own weight pulls it downwards and drags the rest of the plate along with it […] it is a pull from the edge
The gravity-controlled sinking of a cold, denser oceanic slab into the subduction zone (called "slab pull") -- dragging the rest of the plate along with it -- is now considered to be the driving force of plate tectonics.
Source United States Geological Survey, This Dynamic Earth: The Story of Plate Tectonics, “Some unanswered questions” page, section “What drives the plates?” (https://pubs.usgs.gov/gip/dynamic/unanswered.html).
Open access open the source · checked on 24 October 2026
- ↑
Passage Over 80 years […] at five centimetres a year, about four metres
Along it, the Pacific Plate has been grinding horizontally past the North American Plate for 10 million years, at an average rate of about 5 cm/yr.
Source United States Geological Survey, This Dynamic Earth: The Story of Plate Tectonics, “Understanding plate motions” page, passage on the San Andreas Fault (https://pubs.usgs.gov/gip/dynamic/understanding.html).
Open access open the source · checked on 24 October 2026
Passage Over 1 million years: a few tens of kilometres.
The rate of spreading along the Mid-Atlantic Ridge averages about 2.5 centimeters per year (cm/yr), or 25 km in a million years.
Source United States Geological Survey, This Dynamic Earth: The Story of Plate Tectonics, “Understanding plate motions” page (https://pubs.usgs.gov/gip/dynamic/understanding.html).
Open access open the source · checked on 24 October 2026
- ↑
Passage the first published abstract does not mention Marie Tharp
another three years after that until the findings were published as an abstract — without crediting Tharp
Source Université Columbia, Faculté des arts et des sciences, “8 Surprising Facts About Marie Tharp”, point 3 of the article.
Open access open the source · checked on 9 September 2026
Passage The first results were presented in the mid-1950s.
In 1956, Ewing and Heezen showed the results of the Lamont work at an American Geophysical Union meeting in Toronto.
Source EarthDate, “First Map of the Ocean Floor”, episode 286, Switch Energy Alliance, 19 October 2022, episode “Background” text, sub-bullet of the bullet “Faced with this corroborating data, in 1953…”.
Open access open the source · checked on 27 October 2026
- ↑
Passage In 1977, Tharp and Heezen published the first composite world map of the ocean floor
Over the course of 20 years, Tharp continued her partnership with Heezen, mapping the ocean floor and incorporating new sources of data as they emerged. In 1977, the team commissioned Austrian painter Heinrich Berann — famous for his Alpine panoramas — to hand-paint the world ocean floor map, the first realistic depiction of complete ocean-floor bathymetry.
Source Snow, Meagan and Pastuch, Carissa, “The Woman Who Mapped the Ocean”, Library of Congress Magazine, March-April 2026, 11th paragraph of the article.
Open access open the source · checked on 27 October 2026
Passage In 1977, Tharp and Heezen published […] revealing an undersea mountain chain more than 60,000 km long
The mountainous ridge was shown to run for 40,350 mi through the world’s oceans, like the stitching on a baseball. […] In the late 1960’s, she and Dr. Heezen collaborated with Austrian painter Heinrich Berann to produce colored physiographic maps of the Indian Ocean in 1967 and the world ocean in 1977.
Source EarthDate, “First Map of the Ocean Floor”, episode 286, Switch Energy Alliance, 19 October 2022, episode “Background” text, 5th sub-bullet of the bullet “Meanwhile, Bruce began another project…”; 3rd sub-bullet of the bullet “Marie translated the numerical details of the profiles…”.
Open access open the source · checked on 27 October 2026
- ↑
Passage she received the Hubbard Medal in 1978
1978: Marie Tharp
Source National Geographic Society, “Awards”, liste des lauréats de la médaille Hubbard (“Past Awardees”), Hubbard Medal section, “Past Awardees” list.
Open access open the source · checked on 24 October 2026
Passage in 1997 the Library of Congress ranked her among the most important cartographers of the twentieth century
Tharp herself received an outstanding achievement award from the Society of Women Geographers in 1996, and the Library's Phillips Society honored her as one the 20th Century's Outstanding Cartographers in 1997.
Source Evans, Rachel, “Plumbing Depths to Reach New Heights: Marie Tharp Explains Marine Geological Maps”, Library of Congress Information Bulletin, vol. 61, no. 11, November 2002, 14th paragraph of the article (passage on the awards).
Open access open the source · checked on 24 October 2026
Bibliography
15
- Doel, Ronald E., Levin, Tanya J. and Marker, Mason K., “Extending Modern Cartography to the Ocean Depths: Military Patronage, Cold War Priorities, and the Heezen-Tharp Mapping Project, 1952-1959”, Journal of Historical Geography, vol. 32, 2006, p. 605-626, paywalled (the military context and the cross-check with the seismic maps drawn up for the cables).
- EarthDate, “First Map of the Ocean Floor”, episode 286, Switch Energy Alliance, 19 October 2022, open access (the earthquake zones to be avoided in routing transatlantic cables; the epicentres mapped by Howard Foster at the same scale as Marie Tharp’s profiles; the results presented in 1956 in Toronto; the world map painted by Berann, published in 1977, and the ridge 40,350 miles long). https://www.earthdate.org/episodes/first-map-of-the-ocean-floor
- Evans, Rachel, “Plumbing Depths to Reach New Heights: Marie Tharp Explains Marine Geological Maps”, Library of Congress Information Bulletin, vol. 61, no. 11, November 2002, open access (the 1997 ranking among the great cartographers of the century; women barred from the Vema; a first voyage dated 1965). https://www.loc.gov/loc/lcib/0211/tharp.html
- Felt, Hali, Soundings: The Story of the Remarkable Woman Who Mapped the Ocean Floor, Henry Holt, 2012, in libraries (detailed biography; the working conditions).
- Felt, Hali, “Marie Tharp, Plate Tectonics Pioneer”, GSA Today, vol. 27, no. 6, June 2017, p. 32, open access (the profiles redrawn twice before Heezen accepted the existence of the valley). https://rock.geosociety.org/net/gsatoday/archive/27/6/pdf/i1052-5173-27-6-32.pdf
- Heezen, Bruce C. and Tharp, Marie, World Ocean Floor Panorama, carte, 1977, in libraries (the first synthetic world map).
- Heezen, Bruce C., Tharp, Marie and Ewing, Maurice, The Floors of the Oceans: I. The North Atlantic, Geological Society of America, 1959, in libraries (the first comprehensive publication).
- National Geographic Society, “Awards”, liste des lauréats de la médaille Hubbard (“Past Awardees”), open access (the Hubbard Medal awarded to Marie Tharp in 1978, along with Bruce Heezen and James E. Webb). https://www.nationalgeographic.org/society/awards
- Oreskes, Naomi, The Rejection of Continental Drift: Theory and Method in American Earth Science, Oxford University Press, 1999, in libraries (her thesis: in the United States, drift was rejected not for lack of a mechanism, but because it seemed to conflict with the standards of practice of American geology). https://histsci.fas.harvard.edu/publications/rejection-continental-drift-theory-and-method-american-earth-science
- Snow, Meagan and Pastuch, Carissa, “The Woman Who Mapped the Ocean”, Library of Congress Magazine, March-April 2026, open access (the Bell Laboratories project and the map of epicentres drawn up by Heezen and Howard Foster; the world ocean floor map painted by Berann in 1977, the “first realistic depiction” of the whole ocean bathymetry). https://lcm.loc.gov/?p=13638
- Tharp, Marie, “Connect the Dots: Mapping the Seafloor and Discovering the Mid-ocean Ridge”, dans Lippsett, Laurence (dir.), Lamont-Doherty Earth Observatory of Columbia: Twelve Perspectives on the First Fifty Years, 1999, open access (the six profiles and the single notch that coincides; Heezen’s reaction and the “girl talk”; drift regarded as a heresy; the epicentres in the valley; the Cousteau episode). https://www.whoi.edu/news-insights/content/marie-tharp/
- United States Geological Survey, This Dynamic Earth: The Story of Plate Tectonics, open access (the division of the lithosphere, the measured speeds, the three types of boundary, the pull from the sinking edge; the question of forces that Wegener could not answer, and the “mere meteorologist” regarded by geologists as an outsider). https://pubs.usgs.gov/gip/dynamic/inside.html
- Université Columbia, Faculté des arts et des sciences, “8 Surprising Facts About Marie Tharp”, open access (the six profiles, the delay before publication, the first abstract without her name, Cousteau’s expedition, shown in 1959; a first research cruise dated 1968). https://science.fas.columbia.edu/news/8-surprising-facts-about-marie-tharp-mapmaker-extraordinaire
- Wegener, Alfred, Die Entstehung der Kontinente und Ozeane, 2nd, completely revised edition, Vieweg, Braunschweig, 1920, public domain (the thesis of horizontal movements of the continents; the first two publications in 1912). https://www.gutenberg.org/ebooks/45460
- Wegener, Alfred, Die Entstehung der Kontinente und Ozeane, Vieweg, 1915, public domain (the original thesis).
Spotted an error or have a doubt? Write to us.