
On climate, there is not one disagreement but two, and they are not of the same kind.
This distinction matters more than any figure on this page.
The mechanism, in four steps
Before the disagreements, the mechanism itself. It is short, and no one disputes it.
One. The Sun sends out light. Part of it is reflected back into space by clouds, snow and ice; the rest is absorbed by the ground and the oceans, which warm up.
Two. Every warm body radiates. The warmed Earth therefore sends energy back upwards, but in another form: invisible infrared, of longer wavelength than the light received.
Three. Certain gases in the atmosphere let sunlight through but absorb this infrared, then re-emit it in all directions — including downwards. They are called greenhouse gases: water vapour, carbon dioxide (CO₂), methane. They act like a blanket: they do not add heat; they slow its escape.
Four. Without them, the average surface temperature would be about −18 °C. It is about +14 to +15 °C depending on which organisation is cited — a difference of some thirty degrees. The greenhouse effect is therefore not a problem: it is what makes the Earth habitable. The problem is its intensification.1
What humans have changed
By burning coal, oil and gas, we are putting back into the atmosphere carbon that had been removed from it and buried over hundreds of millions of years. Deforestation and agriculture add their share.
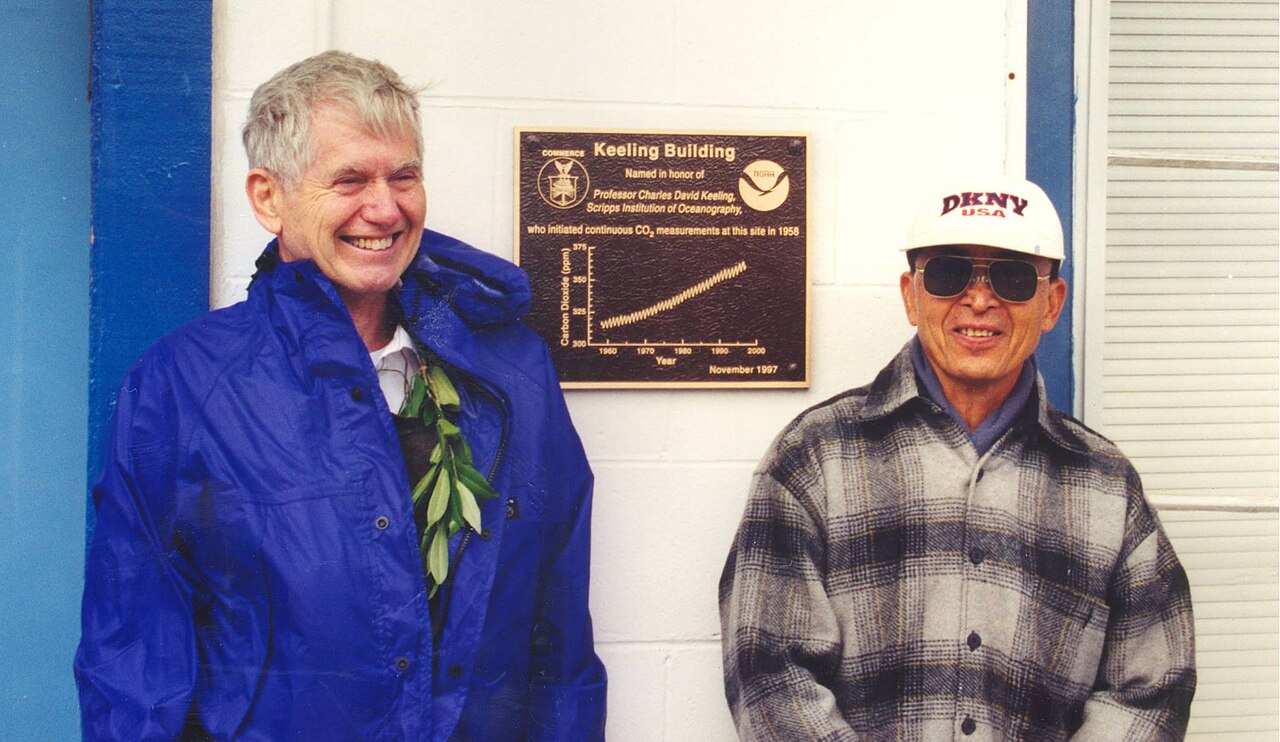
The blanket thickens, heat escapes more slowly, the temperature rises. The concentration of CO₂ in the atmosphere rose from about 280 parts per million before the industrial era to nearly 424 in 2024 — half as much again — and higher than at any time in the last eight hundred thousand years — which we know from the air bubbles trapped in ancient ice.2
Nothing in this chain is a recent hypothesis. That CO₂ absorbs infrared was measured in the laboratory by John Tyndall in 1859. What is debated comes after that, and that is the subject of this page.3
The two disagreements
The first concerns what is. Is the Earth warming? By how much? Why?
This kind of disagreement is settled by measurement. One looks, compares, and checks again. On these questions, it has been very largely settled — the rest of this page explains how.
The second concerns what should be done. Which decisions? At what cost? Who pays? In what order?
That one is not settled by measurement, because it is not a question of fact. It is a political question, in the true sense of the word: it concerns collective choices, and people do not have the same interests or the same values.
This site has a rule for live subjects: describe the disagreement without settling it. It applies to the second. It does not apply to the first — applying it there would amount to presenting as undecidable what has been decided.
This distinction is worth keeping in mind: it is useful on many other subjects.
How we know it is not the Sun
Here is one of the finest pieces of reasoning on this whole site, and it can be followed in full.
Two explanations compete: the Sun is heating more, or the gases we emit are holding in the heat.
At ground level, they predict exactly the same thing: it gets warmer. There is no way to tell them apart there.
So one has to look for where they do not predict the same thing.
If it were the Sun: the whole atmosphere would warm, from the ground to the top. This is what climate scientists point out: if the warming of the lower atmosphere came from the Sun, the upper stratosphere would also warm instead of cooling.4
If it is the greenhouse gases: the heat is held in down below. So the lower atmosphere warms — and the upper atmosphere, above it, cools.
Two opposite predictions, in the same place. All that remains is to go and look.
What is observed is the second case: the troposphere is warming, the stratosphere is cooling.5
This reasoning has a name on this site: the counterfactual test. If the other explanation were the right one, what would be different? This is how it is established that the tides do not come from the Earth’s rotation, that astronauts do not float for lack of gravity, and how Newton showed that colours are in the light and not in the glass. The same tool, more than three centuries apart.
The measurement is even more reliable than one might think: the upper atmosphere is much less turbulent than the lower one, where the ocean creates year-to-year variations, so a forced trend is easier to detect there. A 2023 study shows that by adding measurements from the upper stratosphere, the ratio between the human signal and natural noise is multiplied by five. Its authors see in this a human fingerprint on a global scale, of which stratospheric cooling is one of the main features.6
Two caveats, as always. The cooling of the upper atmosphere has several causes — greenhouse gases, but also ozone depletion and major volcanic eruptions: it cannot be attributed to greenhouse gases alone. Series of measurements at altitude are difficult to splice together across instruments, which has fuelled divergent interpretations.
The “97%”, and what it really measures
This figure is everywhere: 97% of scientists are said to agree on human-caused warming.
It comes from a study published in 2013, and it is worth stating exactly what that study did — because it is instructive both ways.
The calculation
The team examined thousands of scientific papers and sorted them into three groups:
- 66.4% did not take a position on the cause.
- 32.6% attributed it to human activity.
- 0.7% rejected it.7
The 97% is the ratio of those that endorse it to all those that take a position. It does not cover all the papers, and it does not concern scientists.
There is no cheating here: that is the question the study asked. But it is not what the phrase “97% of scientists” implies.
One question, three results
This is where the case becomes fascinating.
Depending on how the “no position” box is treated, one obtains very different figures:
- about a third if they are counted as disagreements,
- 97% if they are set aside,
- 99.99% in another study, on other papers, which counts the “no position” papers as agreements.8
Three figures, one and the same question of method. Most of the gap comes down to how a single box is treated.
An argument, and the debate over it
How can one know which treatment is the right one?
The author of the 99.99%, James Powell, proposes a test. Apply the method to another field — for example plate tectonics.
Most geology papers take no position on the existence of plates: they assume it, because it is accepted. In his view, this silence does not signal doubt: he therefore counts the “no position” papers as agreements.
Another author replies that this test settles nothing: applied to geology, the method of the 2013 study also yields complete agreement. Both accept the human origin of the warming; they differ on how to count.9
Other measurements, other methods
Other teams have repeated the work using different methods.
A 2021 analysis covering about 3,000 papers finds only four in disagreement.10
Another, the same year, questions researchers directly: from 91% to 100% agreement depending on the degree of expertise, and 100% among the climate scientists who have published most on the subject.11
Several different methods, compatible results. That is the real strength of the case — far more than the figure of 97%.
Why this page insists
Because neither “97% of scientists” nor “97% of studies” describes what the study measured.
Because a badly stated figure, even in the service of a correct conclusion, gives a foothold to those who want to dispute it. They do not need to attack the substance: they need only show that the sentence is inaccurate.
The scientific consensus on the human origin of the warming is real, measured by several independent methods. That is precisely why it deserves to be stated correctly.
What a company knew, and when
There is a second case on this page, and it is not about the climate itself. It is about what was said publicly.
In January 2023, a major scientific journal published the first systematic assessment of an oil company’s climate projections.12
Three researchers gathered all the warming projections produced by the company’s scientists between 1977 and 2003 — in internal memos and in published papers. In all, sixteen temperature projections, presented in twelve graphs and one table.13
Then they did something specific: they did not judge intentions. They tested these projections against the temperatures observed since, using the statistical techniques employed by international experts.
The result
Depending on the measure used, 63 to 83% of the projections are statistically consistent with what actually happened.14
The company’s scientists predicted a warming of 0.20 °C per decade, to within 0.04. That is what happened.15
They had also ruled out the hypothesis of a coming cooling, predicted that warming would become detectable around the year 2000, to within five years, and reasonably estimated the amount of carbon compatible with a two-degree limit.16
The figure that closes the case
One might object: perhaps these projections were right by luck, or so vague as to commit to nothing.
The authors therefore compared the quality of these models with that of the academic and government models published at the same time.
Skill score: 67 to 75%. Uncertainty margin: about 21%.17
These values are of the same order as those of the independent models. Their projections were, the authors write, at least as good as those of the academic world.18
The significance of this result must be weighed. The core of the case for doubt was the claim that climate models are not reliable. Yet the company had models that were as reliable as those it was calling into question.
The authors sum it up in one sentence: on each of these points, the company’s public statements about climate science contradicted its own scientific data.19
The company’s response
Questioned by the press in January 2023, it replied that those accusing it are wrong in their conclusions, and that its understanding of climate science has developed along with that of the broader scientific community.20
We report it because that is the rule: when a page challenges someone, their response is included.
Readers can compare the two positions and read the documents cited on both sides for themselves.
And two warnings, as always
One should not conclude from this that no research can be believed. These particular projections were good. What was lacking was not the science: it was what was said about it publicly.
One should not turn this into the story of three heroes. These researchers drew on journalistic investigations carried out in 2015 and on their own earlier work.21
One last detail
How did this study begin?
It began with a graph reproducing the company’s projections, published in an earlier article. It was superimposed on the temperatures actually observed.
The overlap was striking. That was the starting point of the study.
Two curves laid one on top of the other — exactly the gesture that, in a room at the Lamont observatory, had revealed the mid-ocean ridge.
Current measurements and projections
To round off this overview, two sets of figures give the current orders of magnitude.
| Period / Scenario | Observed or projected warming | Source / Reference |
|---|---|---|
| From 1850–1900 to 2016–2025 | +1.26 °C on average over the decade (range 1.13 to 1.36 °C); human share: 1.37 °C in 2025, rising by about 0.27 °C per decade | Forster et al., 2026 (IPCC 1850–1900 baseline) |
| 2081–2100 (Low scenario / SSP1-2.6) | +1.3 °C to +2.4 °C | Pathway with strong emission reductions |
| 2081–2100 (Intermediate scenario / SSP2-4.5) | +2.1 °C to +3.5 °C | Current-policies pathway |
| 2081–2100 (High scenario / SSP5-8.5) | +3.3 °C to +5.7 °C | Very-high-emissions pathway |
Sources for the table22
The 1850–1900 reference period is a statistical convention adopted to represent the pre-industrial climate before massive carbon emissions. The scenario ranges are those the IPCC judges “very likely”.23
Note 1
If there were no greenhouse effect, the Earth’s average surface temperature would be a very chilly -18°C (0°F) instead of the comfortable 15°C (59°F) that it is today.
NASA, “Global Warming”, Earth Science Communications
Note 2
The pre-industrial level of 278.3 ppm represented a balance of fluxes among the atmosphere, the oceans and the land biosphere. The globally averaged CO2 concentration in 2024 was 423.9±0.2 ppm (Figure 5a), 152% of the pre-industrial level.
Organisation météorologique mondiale, Bulletin sur les gaz à effet de serre, éditions annuelles
In 2024 it was 423.9 ppm.
Organisation météorologique mondiale, “Carbon Dioxide Levels Increase by Record Amount to New Highs in 2024”, communiqué sur le Bulletin sur les gaz à effet de serre no. 21, 15 October 2025
Note 3
I determined approximately the absorption of nine gases and twenty vapours during the summer of 1859. […] for atmospheric tensions, carbonic acid probably absorbs nearly 100 times as much as oxygen.
Tyndall, John, “On the Absorption and Radiation of Heat by Gases and Vapours”, Philosophical Transactions of the Royal Society, vol. 151, 1861
Note 4
If tropospheric warming were solely due to solar activity, warming rather than cooling of the upper stratosphere would be expected (15, 23, 65).
Santer, Benjamin D. et al., “Exceptional Stratospheric Contribution to Human Fingerprints on Atmospheric Temperature”, Proceedings of the National Academy of Sciences, vol. 120, e2300758120, 2023
Note 5
Key features of this global-scale human fingerprint include stratospheric cooling and tropospheric warming at all latitudes, with stratospheric cooling amplifying with height.
Santer, Benjamin D. et al., “Exceptional Stratospheric Contribution to Human Fingerprints on Atmospheric Temperature”, Proceedings of the National Academy of Sciences, vol. 120, e2300758120, 2023
Note 6
increases signal-to-noise ratios by a factor of five […] Key features of this global-scale human fingerprint include stratospheric cooling
Santer, Benjamin D. et al., “Exceptional Stratospheric Contribution to Human Fingerprints on Atmospheric Temperature”, Proceedings of the National Academy of Sciences, vol. 120, e2300758120, 2023
Note 7
We find that 66.4% of abstracts expressed no position on AGW, 32.6% endorsed AGW, 0.7% rejected AGW and 0.3% were uncertain about the cause of global warming.
Cook, John et al., “Quantifying the Consensus on Anthropogenic Global Warming in the Scientific Literature”, Environmental Research Letters, vol. 8, 024024, 2013
Note 8
We find that 66.4% of abstracts expressed no position on AGW, 32.6% endorsed AGW, 0.7% rejected AGW and 0.3% were uncertain about the cause of global warming.
Cook, John et al., “Quantifying the Consensus on Anthropogenic Global Warming in the Scientific Literature”, Environmental Research Letters, vol. 8, 024024, 2013
Powell’s methodology was to search the Web of Science to review abstracts from 2013 and 2014. […] Assuming the rest of the abstracts endorsed AGW, this gives consensus figures of 99.98% (by abstract) and 99.99% (by author).
Skuce, Andy, “James Powell is wrong about the 99.99% AGW consensus”, Skeptical Science, 12 April 2016
Note 9
the methodology works just fine for plate tectonics and produces a 100% consensus
Skuce, Andy, “James Powell is wrong about the 99.99% AGW consensus”, Skeptical Science, 12 April 2016
Note 10
From a dataset of 88125 climate-related papers published since 2012, when this question was last addressed comprehensively, we examine a randomized subset of 3000 such publications. […] We identify four sceptical papers out of the sub-set of 3000, as evidenced by abstracts that were rated as implicitly or explicitly sceptical of human-caused global warming.
Lynas, Mark, Houlton, Benjamin Z. and Perry, Simon, “Greater than 99 % Consensus on Human Caused Climate Change in the Peer-Reviewed Scientific Literature”, Environmental Research Letters, vol. 16, no. 11, 114005, 2021
Note 11
agreement on anthropogenic global warming is high (91% to 100%) and generally increases with expertise […] there was 100% agreement that the Earth is warming mostly because of human activity
Myers, Krista F., Doran, Peter T., Cook, John, Kotcher, John and Myers, Teresa A., “Consensus Revisited: Quantifying Scientific Agreement on Climate Change and Climate Expertise among Earth Scientists 10 Years Later”, Environmental Research Letters, vol. 16, no. 10, 104030, 2021
Note 12
Climate projections by the fossil fuel industry have never been assessed.
Supran, Geoffrey, Rahmstorf, Stefan and Oreskes, Naomi, “Assessing ExxonMobil’s Global Warming Projections”, Science, vol. 379, no. 6628, eabk0063, 2023
Note 13
This yields 12 documents published between 1977 and 2003, which contain 16 distinct temperature projections presented in the form of 12 unique graphs and one table
Supran, Geoffrey, Rahmstorf, Stefan and Oreskes, Naomi, “Assessing ExxonMobil’s Global Warming Projections”, Science, vol. 379, no. 6628, eabk0063, 2023
Note 14
Using established statistical techniques, we find that 63 to 83% of the climate projections reported by ExxonMobil scientists were accurate in predicting subsequent global warming.
Supran, Geoffrey, Rahmstorf, Stefan and Oreskes, Naomi, “Assessing ExxonMobil’s Global Warming Projections”, Science, vol. 379, no. 6628, eabk0063, 2023
Note 15
ExxonMobil's average projected warming was 0.20° ± 0.04°C per decade
Supran, Geoffrey, Rahmstorf, Stefan and Oreskes, Naomi, “Assessing ExxonMobil’s Global Warming Projections”, Science, vol. 379, no. 6628, eabk0063, 2023
Note 16
correctly dismissed the possibility of a coming ice age […] accurately predicted that human-caused global warming would first be detectable in the year 2000 ± 5
Supran, Geoffrey, Rahmstorf, Stefan and Oreskes, Naomi, “Assessing ExxonMobil’s Global Warming Projections”, Science, vol. 379, no. 6628, eabk0063, 2023
Note 17
The average "skill score" and level of uncertainty of ExxonMobil's climate models (67 to 75% and ±21%, respectively) were also similar to those of the independent models.
Supran, Geoffrey, Rahmstorf, Stefan and Oreskes, Naomi, “Assessing ExxonMobil’s Global Warming Projections”, Science, vol. 379, no. 6628, eabk0063, 2023
Note 18
Their projections were also consistent with, and at least as skillful as, those of independent academic and government models.
Supran, Geoffrey, Rahmstorf, Stefan and Oreskes, Naomi, “Assessing ExxonMobil’s Global Warming Projections”, Science, vol. 379, no. 6628, eabk0063, 2023
Note 19
On each of these points, however, the company's public statements about climate science contradicted its own scientific data.
Supran, Geoffrey, Rahmstorf, Stefan and Oreskes, Naomi, “Assessing ExxonMobil’s Global Warming Projections”, Science, vol. 379, no. 6628, eabk0063, 2023
Note 20
ExxonMobil's understanding of climate science has developed along with that of the broader scientific community.
Brady, Jeff, “Exxon Climate Predictions Were Accurate Decades Ago. Still It Sowed Doubt”, NPR, repris par Alaska Public Media, 12 January 2023
Note 21
The company has also published some of its internal company documents, originally made public by journalists at InsideClimate News (ICN) [16, 17] (and simultaneously reported by Columbia University's Graduate School of Journalism and the Los Angeles Times [18]), to demonstrate that 'allegations are based on deliberately cherry-picked statements' [14]. […] Our study comprises 187 documents (see table 1): 32 internal documents (from ICN [16], ExxonMobil [59], and Climate Investigations Center [60]); […]
Supran, Geoffrey and Oreskes, Naomi, “Assessing ExxonMobil’s Climate Change Communications
Note 22
For the 2016–2025 decade average, observed warming relative to 1850–1900 was 1.26 [1.13 to 1.36] °C […] Human-induced warming reached 1.37 °C relative to 1850–1900 in the year 2025 […] increasing at a rate of 0.27 [0.2–0.4] °C per decade over 2016–2025
Forster, Piers M., Walsh, Tristram, Smith, Chris et al., “Indicators of Global Climate Change 2025: Annual Update of Key Indicators of the State of the Climate System and Human Influence”, Earth System Science Data, vol. 18, 2026, p. 3889-3933
Compared to 1850-1900, globally averaged surface air temperature over the period 2081-2100 is very likely (at least a 90% probability) to be higher by 1.0°C-1.8°C under SSP1-1.9, 1.3°C-2.4°C under SSP1-2.6, 2.1°C-3.5°C under SSP2-4.5, 2.8°C-4.6°C under SSP3-7.0, and 3.3°C-5.7°C under SSP5-8.5.
Agence européenne pour l’environnement, “Observed and Projected Change in Global Mean Sea Level”, cartes et graphiques, publié le 16 January 2024, modifié le 28 October 2024, open access
Note 23
The period 1850–1900 represents the earliest period of sufficiently globally complete observations to estimate global surface temperature and, consistent with AR5 and SR1.5, is used as an approximation for pre-industrial conditions.
GIEC, Climate Change 2021: The Physical Science Basis, sixième rapport d’évaluation, Groupe de travail I, Cambridge University Press, 2021
Notes and sources
- ↑
Passage Without them, the average surface temperature would be about −18 °C.
If there were no greenhouse effect, the Earth’s average surface temperature would be a very chilly -18°C (0°F) instead of the comfortable 15°C (59°F) that it is today.
Source NASA, “Global Warming”, Earth Science Communications, section “What is Global Warming?”, subsection “Earth’s natural greenhouse effect”.
Open access open the source · checked on 24 October 2026
- ↑
Passage The concentration of CO₂ […] rose from about 280 parts per million before the industrial era
The pre-industrial level of 278.3 ppm represented a balance of fluxes among the atmosphere, the oceans and the land biosphere. The globally averaged CO2 concentration in 2024 was 423.9±0.2 ppm (Figure 5a), 152% of the pre-industrial level.
Source Organisation météorologique mondiale, Bulletin sur les gaz à effet de serre, éditions annuelles, Bulletin No. 21 (16 October 2025), p. 5, section “Carbon dioxide (CO2)”.
Open access open the source · checked on 24 October 2026
Passage to nearly 424 in 2024
In 2024 it was 423.9 ppm.
Source Organisation météorologique mondiale, “Carbon Dioxide Levels Increase by Record Amount to New Highs in 2024”, communiqué sur le Bulletin sur les gaz à effet de serre no. 21, 15 October 2025, press release.
Open access open the source · checked on 24 October 2026
- ↑
Passage That CO₂ absorbs infrared was measured in the laboratory by John Tyndall in 1859
I determined approximately the absorption of nine gases and twenty vapours during the summer of 1859. […] for atmospheric tensions, carbonic acid probably absorbs nearly 100 times as much as oxygen.
Source Tyndall, John, “On the Absorption and Radiation of Heat by Gases and Vapours”, Philosophical Transactions of the Royal Society, vol. 151, 1861, p. 5 (date of the experiments) and p. 27 (absorption by carbonic acid, that is, CO₂).
Public domain open the source · checked on 24 October 2026
- ↑
Passage if the warming of the lower atmosphere came from the Sun, the upper stratosphere would also warm instead of cooling
If tropospheric warming were solely due to solar activity, warming rather than cooling of the upper stratosphere would be expected (15, 23, 65).
Source Santer, Benjamin D. et al., “Exceptional Stratospheric Contribution to Human Fingerprints on Atmospheric Temperature”, Proceedings of the National Academy of Sciences, vol. 120, e2300758120, 2023, p. 9, conclusions.
Open access open the source · checked on 25 October 2026
- ↑
Passage the troposphere is warming, the stratosphere is cooling
Key features of this global-scale human fingerprint include stratospheric cooling and tropospheric warming at all latitudes, with stratospheric cooling amplifying with height.
Source Santer, Benjamin D. et al., “Exceptional Stratospheric Contribution to Human Fingerprints on Atmospheric Temperature”, Proceedings of the National Academy of Sciences, vol. 120, e2300758120, 2023, abstract.
Open access open the source · checked on 24 October 2026
- ↑
Passage by adding measurements from the upper stratosphere, the ratio between the human signal and natural noise is multiplied by five. Its authors see in this a human fingerprint on a global scale, of which stratospheric cooling is one of the main features.
increases signal-to-noise ratios by a factor of five […] Key features of this global-scale human fingerprint include stratospheric cooling
Source Santer, Benjamin D. et al., “Exceptional Stratospheric Contribution to Human Fingerprints on Atmospheric Temperature”, Proceedings of the National Academy of Sciences, vol. 120, e2300758120, 2023, abstract.
Open access · checked on 24 October 2026
- ↑
Passage 66.4% did not take a position on the cause […] 32.6% attributed it to human activity […] 0.7% rejected it
We find that 66.4% of abstracts expressed no position on AGW, 32.6% endorsed AGW, 0.7% rejected AGW and 0.3% were uncertain about the cause of global warming.
Source Cook, John et al., “Quantifying the Consensus on Anthropogenic Global Warming in the Scientific Literature”, Environmental Research Letters, vol. 8, 024024, 2013, abstract.
Open access open the source · checked on 24 October 2026
- ↑
Passage about a third if they are counted as disagreements
We find that 66.4% of abstracts expressed no position on AGW, 32.6% endorsed AGW, 0.7% rejected AGW and 0.3% were uncertain about the cause of global warming.
Source Cook, John et al., “Quantifying the Consensus on Anthropogenic Global Warming in the Scientific Literature”, Environmental Research Letters, vol. 8, 024024, 2013, abstract (the “third” is calculated by the editors from the 32.6%).
Open access open the source · checked on 24 October 2026
Passage 99.99% in another study, on other papers, which counts the “no position” papers as agreements
Powell’s methodology was to search the Web of Science to review abstracts from 2013 and 2014. […] Assuming the rest of the abstracts endorsed AGW, this gives consensus figures of 99.98% (by abstract) and 99.99% (by author).
Source Skuce, Andy, “James Powell is wrong about the 99.99% AGW consensus”, Skeptical Science, 12 April 2016, third paragraph of the post.
Open access open the source · checked on 24 October 2026
- ↑
Passage James Powell, proposes a test […] Another author replies that this test settles nothing: applied to geology, the method of the 2013 study also yields complete agreement.
the methodology works just fine for plate tectonics and produces a 100% consensus
Source Skuce, Andy, “James Powell is wrong about the 99.99% AGW consensus”, Skeptical Science, 12 April 2016, discussion of the plate-tectonics argument.
Open access open the source · checked on 24 October 2026
- ↑
Passage A 2021 analysis covering about 3,000 papers finds only four in disagreement.
From a dataset of 88125 climate-related papers published since 2012, when this question was last addressed comprehensively, we examine a randomized subset of 3000 such publications. […] We identify four sceptical papers out of the sub-set of 3000, as evidenced by abstracts that were rated as implicitly or explicitly sceptical of human-caused global warming.
Source Lynas, Mark, Houlton, Benjamin Z. and Perry, Simon, “Greater than 99 % Consensus on Human Caused Climate Change in the Peer-Reviewed Scientific Literature”, Environmental Research Letters, vol. 16, no. 11, 114005, 2021, abstract.
Open access open the source · checked on 24 October 2026
- ↑
Passage from 91% to 100% agreement depending on the degree of expertise, and 100% among the climate scientists who have published most on the subject
agreement on anthropogenic global warming is high (91% to 100%) and generally increases with expertise […] there was 100% agreement that the Earth is warming mostly because of human activity
Source Myers, Krista F., Doran, Peter T., Cook, John, Kotcher, John and Myers, Teresa A., “Consensus Revisited: Quantifying Scientific Agreement on Climate Change and Climate Expertise among Earth Scientists 10 Years Later”, Environmental Research Letters, vol. 16, no. 10, 104030, 2021, abstract (the most specialised group: more than 20 climate papers published between 2015 and 2019).
Open access open the source · checked on 24 October 2026
- ↑
Passage In January 2023, a major scientific journal published the first systematic assessment of an oil company’s climate projections.
Climate projections by the fossil fuel industry have never been assessed.
Source Supran, Geoffrey, Rahmstorf, Stefan and Oreskes, Naomi, “Assessing ExxonMobil’s Global Warming Projections”, Science, vol. 379, no. 6628, eabk0063, 2023, abstract (article published on 12 January 2023).
Paywalled open the source · checked on 24 October 2026
- ↑
Passage sixteen temperature projections, presented in twelve graphs and one table
This yields 12 documents published between 1977 and 2003, which contain 16 distinct temperature projections presented in the form of 12 unique graphs and one table
Source Supran, Geoffrey, Rahmstorf, Stefan and Oreskes, Naomi, “Assessing ExxonMobil’s Global Warming Projections”, Science, vol. 379, no. 6628, eabk0063, 2023, Materials and methods.
Paywalled open the source · checked on 9 September 2026
- ↑
Passage 63 to 83% of the projections are statistically consistent with what actually happened
Using established statistical techniques, we find that 63 to 83% of the climate projections reported by ExxonMobil scientists were accurate in predicting subsequent global warming.
Source Supran, Geoffrey, Rahmstorf, Stefan and Oreskes, Naomi, “Assessing ExxonMobil’s Global Warming Projections”, Science, vol. 379, no. 6628, eabk0063, 2023, abstract.
Paywalled open the source · checked on 9 September 2026
- ↑
Passage a warming of 0.20 °C per decade, to within 0.04
ExxonMobil's average projected warming was 0.20° ± 0.04°C per decade
Source Supran, Geoffrey, Rahmstorf, Stefan and Oreskes, Naomi, “Assessing ExxonMobil’s Global Warming Projections”, Science, vol. 379, no. 6628, eabk0063, 2023, abstract.
Paywalled open the source · checked on 9 September 2026
- ↑
Passage ruled out the hypothesis of a coming cooling, predicted that warming would become detectable around the year 2000, to within five years
correctly dismissed the possibility of a coming ice age […] accurately predicted that human-caused global warming would first be detectable in the year 2000 ± 5
Source Supran, Geoffrey, Rahmstorf, Stefan and Oreskes, Naomi, “Assessing ExxonMobil’s Global Warming Projections”, Science, vol. 379, no. 6628, eabk0063, 2023, abstract.
Paywalled open the source · checked on 9 September 2026
- ↑
Passage Skill score: 67 to 75%. Uncertainty margin: about 21%.
The average "skill score" and level of uncertainty of ExxonMobil's climate models (67 to 75% and ±21%, respectively) were also similar to those of the independent models.
Source Supran, Geoffrey, Rahmstorf, Stefan and Oreskes, Naomi, “Assessing ExxonMobil’s Global Warming Projections”, Science, vol. 379, no. 6628, eabk0063, 2023, abstract.
Paywalled open the source · checked on 9 September 2026
- ↑
Passage Their projections were […] at least as good as those of the academic world.
Their projections were also consistent with, and at least as skillful as, those of independent academic and government models.
Source Supran, Geoffrey, Rahmstorf, Stefan and Oreskes, Naomi, “Assessing ExxonMobil’s Global Warming Projections”, Science, vol. 379, no. 6628, eabk0063, 2023, abstract.
Paywalled open the source · checked on 9 September 2026
- ↑
Passage on each of these points, the company’s public statements about climate science contradicted its own scientific data
On each of these points, however, the company's public statements about climate science contradicted its own scientific data.
Source Supran, Geoffrey, Rahmstorf, Stefan and Oreskes, Naomi, “Assessing ExxonMobil’s Global Warming Projections”, Science, vol. 379, no. 6628, eabk0063, 2023, abstract.
Paywalled open the source · checked on 9 September 2026
- ↑
Passage Questioned by the press in January 2023, it replied that those accusing it are wrong in their conclusions, and that its understanding of climate science has developed along with that of the broader scientific community.
ExxonMobil's understanding of climate science has developed along with that of the broader scientific community.
Source Brady, Jeff, “Exxon Climate Predictions Were Accurate Decades Ago. Still It Sowed Doubt”, NPR, repris par Alaska Public Media, 12 January 2023, statement by the company’s spokesperson quoted in the article.
Open access open the source · checked on 24 October 2026
- ↑
Passage These researchers drew on journalistic investigations carried out in 2015 and on their own earlier work.
The company has also published some of its internal company documents, originally made public by journalists at InsideClimate News (ICN) [16, 17] (and simultaneously reported by Columbia University's Graduate School of Journalism and the Los Angeles Times [18]), to demonstrate that 'allegations are based on deliberately cherry-picked statements' [14]. […] Our study comprises 187 documents (see table 1): 32 internal documents (from ICN [16], ExxonMobil [59], and Climate Investigations Center [60]); […]
Source Supran, Geoffrey and Oreskes, Naomi, “Assessing ExxonMobil’s Climate Change Communications, section 1 “Introduction”, then section 2 (method), first sentence; references [17] and [18]: 2015 investigations (InsideClimate News, Los Angeles Times).
Open access open the source · checked on 24 October 2026
- ↑
Passage From 1850–1900 to 2016–2025 […] +1.26 °C on average over the decade (range 1.13 to 1.36 °C); human share: 1.37 °C in 2025, rising by about 0.27 °C per decade
For the 2016–2025 decade average, observed warming relative to 1850–1900 was 1.26 [1.13 to 1.36] °C […] Human-induced warming reached 1.37 °C relative to 1850–1900 in the year 2025 […] increasing at a rate of 0.27 [0.2–0.4] °C per decade over 2016–2025
Source Forster, Piers M., Walsh, Tristram, Smith, Chris et al., “Indicators of Global Climate Change 2025: Annual Update of Key Indicators of the State of the Climate System and Human Influence”, Earth System Science Data, vol. 18, 2026, p. 3889-3933, abstract.
Open access open the source · checked on 24 October 2026
Passage 2081–2100 (Low scenario / SSP1-2.6) […] +1.3 °C to +2.4 °C […] +2.1 °C to +3.5 °C […] +3.3 °C to +5.7 °C […] very likely
Compared to 1850-1900, globally averaged surface air temperature over the period 2081-2100 is very likely (at least a 90% probability) to be higher by 1.0°C-1.8°C under SSP1-1.9, 1.3°C-2.4°C under SSP1-2.6, 2.1°C-3.5°C under SSP2-4.5, 2.8°C-4.6°C under SSP3-7.0, and 3.3°C-5.7°C under SSP5-8.5.
Source Agence européenne pour l’environnement, “Observed and Projected Change in Global Mean Sea Level”, cartes et graphiques, publié le 16 January 2024, modifié le 28 October 2024, open access, “Methodology” section, right-hand chart.
Open access open the source · checked on 25 October 2026
- ↑
Passage The 1850–1900 reference period is a statistical convention adopted to represent the pre-industrial climate
The period 1850–1900 represents the earliest period of sufficiently globally complete observations to estimate global surface temperature and, consistent with AR5 and SR1.5, is used as an approximation for pre-industrial conditions.
Source GIEC, Climate Change 2021: The Physical Science Basis, sixième rapport d’évaluation, Groupe de travail I, Cambridge University Press, 2021, Summary for Policymakers, footnote 9.
Open access open the source · checked on 24 October 2026
Bibliography
15
- Agence européenne pour l’environnement, “Observed and Projected Change in Global Mean Sea Level”, cartes et graphiques, publié le 16 January 2024, modifié le 28 October 2024, open access (“Methodology” section: the very likely temperature increases in 2081-2100 relative to 1850-1900 under scenarios SSP1-2.6, SSP2-4.5 and SSP5-8.5). https://www.eea.europa.eu/en/analysis/maps-and-charts/observed-change-in-global-mean-3-figures
- Brady, Jeff, “Exxon Climate Predictions Were Accurate Decades Ago. Still It Sowed Doubt”, NPR, repris par Alaska Public Media, 12 January 2023, open access (the company’s response to the 2023 study). https://alaskapublic.org/news/2023-01-12/exxon-climate-predictions-were-accurate-decades-ago-still-it-sowed-doubt
- Cook, John et al., “Quantifying the Consensus on Anthropogenic Global Warming in the Scientific Literature”, Environmental Research Letters, vol. 8, 024024, 2013, open access (66.4% no position, 32.6% attributing it to humans, 0.7% rejecting it; the 97% ratio).
- Forster, Piers M., Walsh, Tristram, Smith, Chris et al., “Indicators of Global Climate Change 2025: Annual Update of Key Indicators of the State of the Climate System and Human Influence”, Earth System Science Data, vol. 18, 2026, p. 3889-3933, open access (observed warming over 2016–2025 and the human-caused share, annual update). https://doi.org/10.5194/essd-18-3889-2026
- GIEC, Climate Change 2021: The Physical Science Basis, sixième rapport d’évaluation, Groupe de travail I, Cambridge University Press, 2021, open access (the 1850-1900 baseline).
- Lynas, Mark, Houlton, Benjamin Z. and Perry, Simon, “Greater than 99 % Consensus on Human Caused Climate Change in the Peer-Reviewed Scientific Literature”, Environmental Research Letters, vol. 16, no. 11, 114005, 2021, open access (about 3,000 papers examined, four in disagreement). https://doi.org/10.1088/1748-9326/ac2966
- Myers, Krista F., Doran, Peter T., Cook, John, Kotcher, John and Myers, Teresa A., “Consensus Revisited: Quantifying Scientific Agreement on Climate Change and Climate Expertise among Earth Scientists 10 Years Later”, Environmental Research Letters, vol. 16, no. 10, 104030, 2021, open access (agreement measured by direct survey, from 91% to 100% depending on the degree of expertise). https://doi.org/10.1088/1748-9326/ac2774
- NASA, “Global Warming”, Earth Science Communications, open access (the average temperature without the greenhouse effect compared with the actual temperature; the role of fossil fuels and deforestation). https://science.nasa.gov/earth/climate-change/global-warming/
- Organisation météorologique mondiale, “Carbon Dioxide Levels Increase by Record Amount to New Highs in 2024”, communiqué sur le Bulletin sur les gaz à effet de serre no. 21, 15 October 2025, open access (the average CO₂ concentration in 2024). https://www.wmo.int/news/media-centre/carbon-dioxide-levels-increase-record-amount-new-highs-2024
- Organisation météorologique mondiale, Bulletin sur les gaz à effet de serre, éditions annuelles, open access (CO₂ concentrations before the industrial era and today; ice-core data).
- Santer, Benjamin D. et al., “Exceptional Stratospheric Contribution to Human Fingerprints on Atmospheric Temperature”, Proceedings of the National Academy of Sciences, vol. 120, e2300758120, 2023, open access (stratospheric cooling as a fingerprint, and its magnitude compared with natural causes; the warming of the upper stratosphere that would be expected if the Sun were responsible).
- Skuce, Andy, “James Powell is wrong about the 99.99% AGW consensus”, Skeptical Science, 12 April 2016, open access (the method that yields 99.99%; the plate-tectonics argument put forward by James Powell and the reply made to it). https://skepticalscience.com/print.php?n=3347
- Supran, Geoffrey and Oreskes, Naomi, “Assessing ExxonMobil’s Climate Change Communications (1977-2014)”, Environmental Research Letters, vol. 12, 084019, 2017, open access; et enquêtes journalistiques de 2015 (the earlier work on which the 2023 study draws).
- Supran, Geoffrey, Rahmstorf, Stefan and Oreskes, Naomi, “Assessing ExxonMobil’s Global Warming Projections”, Science, vol. 379, no. 6628, eabk0063, 2023, paywalled (sixteen projections, in twelve graphs and one table, between 1977 and 2003; 63 to 83% consistent with observations; 0.20 ± 0.04 °C per decade; a skill score of 67 to 75% with an uncertainty of about 21%, of the same order as the independent models; the rejection of the hypothesis of an ice age; detection predicted around the year 2000 to within five years; the contradiction with public statements; the first assessment of these projections). https://doi.org/10.1126/science.abk0063
- Tyndall, John, “On the Absorption and Radiation of Heat by Gases and Vapours”, Philosophical Transactions of the Royal Society, vol. 151, 1861, public domain (the measurements establishing the absorption of infrared by CO₂ and water vapour).
Spotted an error or have a doubt? Write to us.