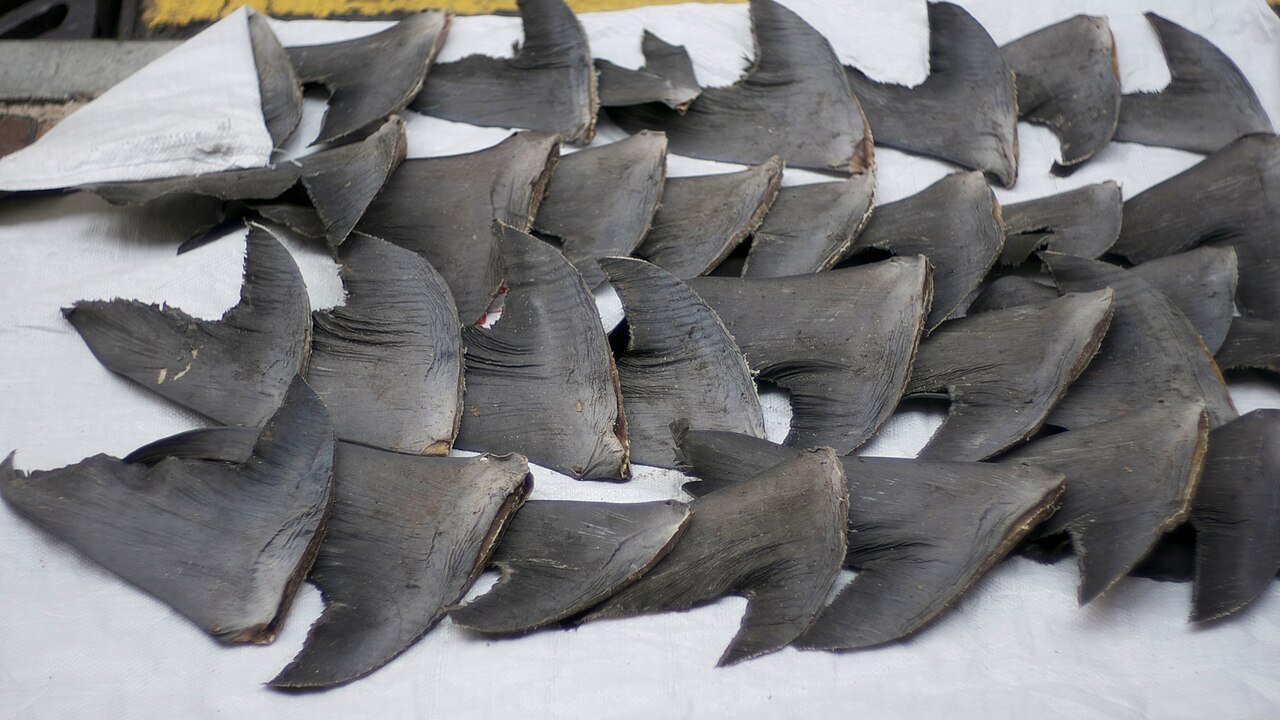

Sharks kill a few people a year. Humans kill tens of millions of them.
This comparison is well known, and it is fundamentally correct. But the figures on either side carry very different weights of evidence.
The first figure: measurable and specific
How many people do sharks kill?
The International Shark Attack File (Florida Museum of Natural History) records these events precisely. For the year 2023, the official tally reports 69 confirmed unprovoked attacks, and 10 deaths.1
This figure is usable: it is dated, its source is identifiable and its methodology explicit (unprovoked attacks only, duly verified).
The second figure: a range of estimates
How many sharks are killed by humans?
The figure circulating in public debate is 100 million a year.
Such a round number signals at once an overall estimate that needs to be broken down. The scientific literature in fact presents a wide range:2
- 20 to 100 million
- 30 to 70 million
- 63 to 273 million
- ~97 million (for the year 2010, with 100 million for the year 2000, in the same study)
A factor of more than 8 separates the lowest estimate from the highest.
These gaps do not reflect fabrication, but a methodological difficulty: fishing mortality on the high seas is assessed through complex models, not through an exhaustive count. The figure of 100 million is one estimate among others, not an absolute count.
A count published in 2024, based on the tracking of more than a billion captured sharks, gives 80 million sharks killed in 2019, of which around 25 million belonged to threatened species — and up to 101 million if catches not identified by species are added. Above all, it delivers an unexpected result: between 2012 and 2019, despite the proliferation of laws banning the removal of fins, total mortality did not fall. It decreased by 7% on the high seas, but increased by 4% along the coasts, where most catches are concentrated. Banning a wasteful practice did not reduce the number of sharks killed.3
The authors even put forward an uncomfortable hypothesis. Once obliged to land the whole shark rather than only its fins, fishers found a market for the meat — and the ban may itself have fed a new market.4
A rule’s effect is not the one expected of it, but what people make of it.5
The key indicator: the renewal rate
The reference study published in 2013 (Marine Policy) did not merely put forward an overall estimate: it established an annual mortality rate.
Each year, between 6.4% and 7.9% of sharks are killed by human activity.6
This rate takes on its full meaning once compared with the renewal capacity of populations, assessed by the same study at 4.9% per year on average across all species. Sharks reach sexual maturity late and have low fecundity; any removal above 5% leads to a structural decline.7
| Indicator | Value |
|---|---|
| Observed mortality rate | 6.4% – 7.9% / year |
| Maximum sustainable threshold | < 5.0% / year |
- The absolute total is striking, but lacks context without the overall population size.
- The mortality rate set against the biological threshold explains the mechanics of the decline.
The scope changes everything
Very different figures circulate about the decline of sharks — 40%, 71%, and others besides. Before settling on one, you need to check what it refers to.
The reference study, published in Nature in 2021, reports a decline of 71%, and it specifically concerns oceanic sharks and rays since 1970. Over this same period, fishing pressure on these species was multiplied by 18.8
A useful clarification, because the two numbers do not measure the same thing: catches of oceanic sharks have, for their part, tripled since 1970. If the pressure was multiplied by eighteen, it is because it relates catches to what remains of the animals. Three times as much is being caught in a much emptier ocean.9
- Incorrect: “71% of sharks have disappeared.”
- Correct: “Populations of oceanic sharks and rays have declined by 71% since 1970.”
Adding the word “oceanic” is decisive: it isolates the species directly exposed to high-seas fishing. Without a precise scope, a statistic loses its scientific value.
Robustness of the data
The assessment rests on the convergence of two independent methodologies:
- An abundance index, calculated from 57 series of measurements covering 18 species of oceanic sharks and rays.
- An extinction risk index, calculated for all 31 known oceanic species.10
Both indicators are long established and are used to monitor international commitments on biodiversity. They converge: three species in four are threatened with extinction.11
A detail the study points out, and one worth noting: the curve shows a sharp break around 1990. The authors hypothesise that it corresponds to the moment when people began to keep captured sharks, instead of discarding them, to meet a new market demand.12
Variability in fisheries management
The situation of marine species varies according to the regulatory frameworks applied. Where quotas are introduced and enforced, the renewal of stocks is documented:13
- Northeast Pacific: 92.7% of stocks managed sustainably.
- Tunas (worldwide): 87% of stocks fished sustainably, and 99% of catches coming from healthy stocks — the result of management by regional organisations and of quotas based on scientific advice.
This figure must nonetheless be read in full, because it bears directly on the subject of this page. Highly migratory sharks are often caught as bycatch in these same tuna fisheries. They do not keep pace: 57% of their assessed stocks are sustainably exploited, compared with 87% for the tunas fished in the same nets. The FAO gives the reason — the lack of consistent international management for these species.14
In other words, the success is real, but targeted: what people wanted to fish was well managed, not what was caught at the same time.
- Southern Ocean (Antarctic): 100% of stocks under sustainable management.
The introduction of binding measures directly determines the stabilisation or recovery of populations.
A note on taxonomy: the “fish” group
The term “fish” reflects common usage but corresponds to no valid taxonomic category in modern phylogenetic classification.
Sharks (chondrichthyans, or cartilaginous fishes) are biologically more distant from tunas or trout (osteichthyans, or bony fishes) than the latter are from tetrapods (including mammals and birds).15
Note 1
The University of Florida’s International Shark Attack File (ISAF), a scientific database of global shark attacks, confirmed 69 unprovoked bites in 2023. […] Ten of the past year’s unprovoked attacks were fatal, up from five the year before, […] While ISAF documents and investigates all bites on humans by sharks, the annual report focuses primarily on unprovoked attacks.
Liang, Jiayu, “Shark bites consistent with recent trends, with small spike in fatalities”, Florida Museum of Natural History, 5 February 2024
Note 2
Based on an analysis of average shark weights, this translates into a total annual mortality estimate of about 100 million sharks in 2000, and about 97 million sharks in 2010, with a total range of possible values between 63 and 273 million sharks per year.
Worm, Boris et al., “Global Catches, Exploitation Rates, and Rebuilding Options for Sharks”, Marine Policy, vol. 40, 2013, p. 194-204
Note 3
Here we estimate that total fishing mortality increased from at least 76 to 80 million sharks between 2012 and 2019, ~25 million of which were threatened species.
Worm, Boris et al., “Global Shark Fishing Mortality Still Rising despite Widespread Regulatory Change”, Science, vol. 383, 2024, p. 225-230
Here we estimate that total fishing mortality increased from at least 76 to 80 million sharks between 2012 and 2019, ~25 million of which were threatened species. Mortality increased by 4% in coastal waters but decreased by 7% in pelagic fisheries, especially across the Atlantic and Western Pacific. By linking fishing mortality data to the global regulatory landscape, we show that widespread legislation designed to prevent shark finning did not reduce mortality but that regional shark fishing or retention bans had some success.
Worm, Boris et al., “Global Shark Fishing Mortality Still Rising despite Widespread Regulatory Change”, Science, vol. 383, 2024, p. 225-230
We present the first global reassessment of 1,199 species in Class Chondrichthyes—sharks, rays, and chimeras. […] When this percentage of threat is applied to Data Deficient species, more than one-third (37.5%) of chondrichthyans are estimated to be threatened, with much of this change resulting from new information.
Dulvy, Nicholas K. et al., “Overfishing Drives Over One-Third of All Sharks and Rays toward a Global Extinction Crisis”, Current Biology, vol. 31, 2021, p. 4773-4787
Here we estimate that total fishing mortality increased from at least 76 to 80 million sharks between 2012 and 2019, ~25 million of which were threatened species.
Worm, Boris et al., “Global Shark Fishing Mortality Still Rising despite Widespread Regulatory Change”, Science, vol. 383, 2024, p. 225-230
When also accounting for sharks not properly identified by species, the global mortality estimate rose to 101 million sharks in 2019.
Tasoff, Harrison, “Unsustainable Fishing of Sharks Is a Global Problem”, UC Santa Barbara, Marine Science Institute, 11 January 2024
Mortality increased by 4% in coastal waters but decreased by 7% in pelagic fisheries, especially across the Atlantic and Western Pacific.
Worm, Boris et al., “Global Shark Fishing Mortality Still Rising despite Widespread Regulatory Change”, Science, vol. 383, 2024, p. 225-230
Note 4
While the researchers found that finning prohibitions likely reduced shark finning at sea, these regulations had little effect on mortality overall. In fact, they may have even increased catches, possibly by incentivising the full use of sharks and creating additional markets for shark meat and other products.
Tasoff, Harrison, “Unsustainable Fishing of Sharks Is a Global Problem”, UC Santa Barbara, Marine Science Institute, 11 January 2024
Note 5
We applied Bayesian statistical methods to trade data in combination with genetic identification to estimate by species, the annual number of globally traded shark fins, the most commercially valuable product from a group of species often unrecorded in harvest statistics.
Clarke, Shelley C. et al., “Global Estimates of Shark Catches Using Trade Records from Commercial Markets”, Ecology Letters, vol. 9, 2006, p. 1115-1126
Note 6
The resulting three independent estimates of the average exploitation rate ranged between 6.4% and 7.9% of sharks killed per year.
Worm, Boris et al., “Global Catches, Exploitation Rates, and Rebuilding Options for Sharks”, Marine Policy, vol. 40, 2013, p. 194-204
Note 7
This exceeds the average rebound rate for many shark populations, estimated from the life history information on 62 shark species (rebound rates averaged 4.9% per year), and explains the ongoing declines in most populations for which data exist.
Worm, Boris et al., “Global Catches, Exploitation Rates, and Rebuilding Options for Sharks”, Marine Policy, vol. 40, 2013, p. 194-204
Note 8
since 1970, the global abundance of oceanic sharks and rays has declined by 71%
Pacoureau, Nathan et al., “Half a Century of Global Decline in Oceanic Sharks and Rays”, Nature, vol. 589, 2021, p. 567-571
owing to an 18-fold increase in relative fishing pressure
Pacoureau, Nathan et al., “Half a Century of Global Decline in Oceanic Sharks and Rays”, Nature, vol. 589, 2021, p. 567-571
Note 9
(1) increasing relative fishing pressure (RFP) over time (measured as changes in catch rates relative to the changes in the LPI) […] Concomitantly, oceanic shark catch rates have increased threefold since 1970 (Fig. 4a), resulting in an 18-fold increase in RFP (Fig. 4b).
Pacoureau, Nathan et al., “Half a Century of Global Decline in Oceanic Sharks and Rays”, Nature, vol. 589, 2021, p. 567-571
Note 10
the Living Planet Index (a measure of changes in abundance aggregated from 57 abundance time-series datasets for 18 oceanic shark and ray species)
Pacoureau, Nathan et al., “Half a Century of Global Decline in Oceanic Sharks and Rays”, Nature, vol. 589, 2021, p. 567-571
the Red List Index (a measure of change in extinction risk calculated for all 31 oceanic species of sharks and rays)
Pacoureau, Nathan et al., “Half a Century of Global Decline in Oceanic Sharks and Rays”, Nature, vol. 589, 2021, p. 567-571
Note 11
three-quarters of the species comprising this functionally important assemblage are threatened with extinction
Pacoureau, Nathan et al., “Half a Century of Global Decline in Oceanic Sharks and Rays”, Nature, vol. 589, 2021, p. 567-571
Note 12
This correlation suggests that fishing drove declines in the abundances of sharks with a notable breakpoint in 1990 that we hypothesize coincides with the increasing retention of sharks to meet new market demands (specifically for fins)
Pacoureau, Nathan et al., “Half a Century of Global Decline in Oceanic Sharks and Rays”, Nature, vol. 589, 2021, p. 567-571
Note 13
Globally, 87 percent of tuna stocks are sustainably fished, and 13 percent are considered overfished. Regarding tuna catch, 99 percent of the total catch comes from healthy tuna stocks in terms of abundance […] Globally, the tuna RFMOs have been making a concerted effort to use management strategy evaluations to provide advice for rebuilding and keeping stocks at biomass levels above the maximum sustainable yield, with positive results.
FAO, La Situation mondiale des pêches et de l’aquaculture 2024, Rome
Note 14
The report also flags concern over highly migratory sharks, often caught as bycatch in tuna fisheries. While 57 percent of stocks assessed are sustainable, lack of consistent international management continues to hinder recovery efforts.
FAO, “FAO releases the most detailed global assessment of marine fish stocks to date”, communiqué de presse, Rome/Nice, 11 June 2025
Note 15
Note also that humans are more closely related to bony fishes than either is to sharks. Phylogenetically speaking, “fish” is an invalid category resulting from different rates of morphological change among lineages and does not reflect real relationships.
Gregory, T. Ryan, “Understanding Evolutionary Trees”, Evolution: Education and Outreach, vol. 1, no. 2, 2008, p. 121-137
Notes and sources
- ↑
Passage The International Shark Attack File (Florida Museum of Natural History) records these events precisely. For the year 2023, the official tally reports 69 confirmed unprovoked attacks, and 10 deaths
The University of Florida’s International Shark Attack File (ISAF), a scientific database of global shark attacks, confirmed 69 unprovoked bites in 2023. […] Ten of the past year’s unprovoked attacks were fatal, up from five the year before, […] While ISAF documents and investigates all bites on humans by sharks, the annual report focuses primarily on unprovoked attacks.
Source Liang, Jiayu, “Shark bites consistent with recent trends, with small spike in fatalities”, Florida Museum of Natural History, 5 February 2024, article, paragraphs 1 and 2, then the part on unprovoked attacks.
Open access open the source · checked on 9 September 2026
- ↑
Passage The scientific literature in fact presents a wide range: […] 63 to 273 million
Based on an analysis of average shark weights, this translates into a total annual mortality estimate of about 100 million sharks in 2000, and about 97 million sharks in 2010, with a total range of possible values between 63 and 273 million sharks per year.
Source Worm, Boris et al., “Global Catches, Exploitation Rates, and Rebuilding Options for Sharks”, Marine Policy, vol. 40, 2013, p. 194-204, abstract.
Paywalled · checked on 25 October 2026
- ↑
Passage A count published in 2024 […] gives 80 million sharks killed in 2019, of which around 25 million belonged to threatened species
Here we estimate that total fishing mortality increased from at least 76 to 80 million sharks between 2012 and 2019, ~25 million of which were threatened species.
Source Worm, Boris et al., “Global Shark Fishing Mortality Still Rising despite Widespread Regulatory Change”, Science, vol. 383, 2024, p. 225-230, abstract.
Paywalled · checked on 25 October 2026
Passage between 2012 and 2019, despite the proliferation of laws banning the removal of fins, total mortality did not fall […] decreased by 7% on the high seas, but increased by 4% along the coasts
Here we estimate that total fishing mortality increased from at least 76 to 80 million sharks between 2012 and 2019, ~25 million of which were threatened species. Mortality increased by 4% in coastal waters but decreased by 7% in pelagic fisheries, especially across the Atlantic and Western Pacific. By linking fishing mortality data to the global regulatory landscape, we show that widespread legislation designed to prevent shark finning did not reduce mortality but that regional shark fishing or retention bans had some success.
Source Worm, Boris et al., “Global Shark Fishing Mortality Still Rising despite Widespread Regulatory Change”, Science, vol. 383, 2024, p. 225-230, abstract.
Paywalled · checked on 9 September 2026
Passage the assessment of all sharks and rays
We present the first global reassessment of 1,199 species in Class Chondrichthyes—sharks, rays, and chimeras. […] When this percentage of threat is applied to Data Deficient species, more than one-third (37.5%) of chondrichthyans are estimated to be threatened, with much of this change resulting from new information.
Source Dulvy, Nicholas K. et al., “Overfishing Drives Over One-Third of All Sharks and Rays toward a Global Extinction Crisis”, Current Biology, vol. 31, 2021, p. 4773-4787, Summary (abstract), p. 1.
Open access · checked on 24 October 2026
Passage 80 million sharks killed in 2019, of which around 25 million belonged to threatened species
Here we estimate that total fishing mortality increased from at least 76 to 80 million sharks between 2012 and 2019, ~25 million of which were threatened species.
Source Worm, Boris et al., “Global Shark Fishing Mortality Still Rising despite Widespread Regulatory Change”, Science, vol. 383, 2024, p. 225-230, abstract.
Paywalled · checked on 9 September 2026
Passage up to 101 million if catches not identified by species are added
When also accounting for sharks not properly identified by species, the global mortality estimate rose to 101 million sharks in 2019.
Source Tasoff, Harrison, “Unsustainable Fishing of Sharks Is a Global Problem”, UC Santa Barbara, Marine Science Institute, 11 January 2024, news article, body text.
Open access open the source · checked on 9 September 2026
Passage It decreased by 7% on the high seas, but increased by 4% along the coasts
Mortality increased by 4% in coastal waters but decreased by 7% in pelagic fisheries, especially across the Atlantic and Western Pacific.
Source Worm, Boris et al., “Global Shark Fishing Mortality Still Rising despite Widespread Regulatory Change”, Science, vol. 383, 2024, p. 225-230, abstract.
Paywalled · checked on 9 September 2026
- ↑
Passage Once obliged to land the whole shark rather than only its fins, fishers found a market for the meat — and the ban may itself have fed a new market.
While the researchers found that finning prohibitions likely reduced shark finning at sea, these regulations had little effect on mortality overall. In fact, they may have even increased catches, possibly by incentivising the full use of sharks and creating additional markets for shark meat and other products.
Source Tasoff, Harrison, “Unsustainable Fishing of Sharks Is a Global Problem”, UC Santa Barbara, Marine Science Institute, 11 January 2024, news article, body text.
Open access open the source · checked on 9 September 2026
- ↑
For this whole section
Passage an estimate based on commercial records
We applied Bayesian statistical methods to trade data in combination with genetic identification to estimate by species, the annual number of globally traded shark fins, the most commercially valuable product from a group of species often unrecorded in harvest statistics.
Source Clarke, Shelley C. et al., “Global Estimates of Shark Catches Using Trade Records from Commercial Markets”, Ecology Letters, vol. 9, 2006, p. 1115-1126, abstract.
Paywalled · checked on 25 October 2026
- ↑
Passage Each year, between 6.4% and 7.9% of sharks are killed by human activity.
The resulting three independent estimates of the average exploitation rate ranged between 6.4% and 7.9% of sharks killed per year.
Source Worm, Boris et al., “Global Catches, Exploitation Rates, and Rebuilding Options for Sharks”, Marine Policy, vol. 40, 2013, p. 194-204, abstract.
Paywalled · checked on 25 October 2026
- ↑
Passage the renewal capacity of populations, assessed by the same study at 4.9% per year on average
This exceeds the average rebound rate for many shark populations, estimated from the life history information on 62 shark species (rebound rates averaged 4.9% per year), and explains the ongoing declines in most populations for which data exist.
Source Worm, Boris et al., “Global Catches, Exploitation Rates, and Rebuilding Options for Sharks”, Marine Policy, vol. 40, 2013, p. 194-204, abstract.
Paywalled · checked on 25 October 2026
- ↑
Passage a decline of 71% […] specifically concerns oceanic sharks and rays since 1970
since 1970, the global abundance of oceanic sharks and rays has declined by 71%
Source Pacoureau, Nathan et al., “Half a Century of Global Decline in Oceanic Sharks and Rays”, Nature, vol. 589, 2021, p. 567-571, abstract.
Paywalled open the source · checked on 9 September 2026
Passage fishing pressure on these species was multiplied by 18
owing to an 18-fold increase in relative fishing pressure
Source Pacoureau, Nathan et al., “Half a Century of Global Decline in Oceanic Sharks and Rays”, Nature, vol. 589, 2021, p. 567-571, abstract.
Paywalled open the source · checked on 9 September 2026
- ↑
Passage catches of oceanic sharks have, for their part, tripled since 1970 […] it relates catches to what remains of the animals
(1) increasing relative fishing pressure (RFP) over time (measured as changes in catch rates relative to the changes in the LPI) […] Concomitantly, oceanic shark catch rates have increased threefold since 1970 (Fig. 4a), resulting in an 18-fold increase in RFP (Fig. 4b).
Source Pacoureau, Nathan et al., “Half a Century of Global Decline in Oceanic Sharks and Rays”, Nature, vol. 589, 2021, p. 567-571, p. 569-570.
Paywalled open the source · checked on 9 September 2026
- ↑
Passage An abundance index, calculated from 57 series of measurements covering 18 species
the Living Planet Index (a measure of changes in abundance aggregated from 57 abundance time-series datasets for 18 oceanic shark and ray species)
Source Pacoureau, Nathan et al., “Half a Century of Global Decline in Oceanic Sharks and Rays”, Nature, vol. 589, 2021, p. 567-571, abstract.
Paywalled open the source · checked on 9 September 2026
Passage An extinction risk index, calculated for all 31 known oceanic species
the Red List Index (a measure of change in extinction risk calculated for all 31 oceanic species of sharks and rays)
Source Pacoureau, Nathan et al., “Half a Century of Global Decline in Oceanic Sharks and Rays”, Nature, vol. 589, 2021, p. 567-571, abstract.
Paywalled open the source · checked on 9 September 2026
- ↑
Passage three species in four are threatened with extinction
three-quarters of the species comprising this functionally important assemblage are threatened with extinction
Source Pacoureau, Nathan et al., “Half a Century of Global Decline in Oceanic Sharks and Rays”, Nature, vol. 589, 2021, p. 567-571, abstract.
Paywalled open the source · checked on 9 September 2026
- ↑
Passage the curve shows a sharp break around 1990 […] the moment when people began to keep captured sharks […] to meet a new market demand
This correlation suggests that fishing drove declines in the abundances of sharks with a notable breakpoint in 1990 that we hypothesize coincides with the increasing retention of sharks to meet new market demands (specifically for fins)
Source Pacoureau, Nathan et al., “Half a Century of Global Decline in Oceanic Sharks and Rays”, Nature, vol. 589, 2021, p. 567-571, p. 570.
Paywalled open the source · checked on 9 September 2026
- ↑
Passage Where quotas are introduced and enforced, the renewal of stocks is documented […] major tuna stocks
Globally, 87 percent of tuna stocks are sustainably fished, and 13 percent are considered overfished. Regarding tuna catch, 99 percent of the total catch comes from healthy tuna stocks in terms of abundance […] Globally, the tuna RFMOs have been making a concerted effort to use management strategy evaluations to provide advice for rebuilding and keeping stocks at biomass levels above the maximum sustainable yield, with positive results.
Source FAO, La Situation mondiale des pêches et de l’aquaculture 2024, Rome, section “Status of fishery resources”, subsection “Status and trends by major species” (tunas).
Open access open the source · checked on 24 October 2026
- ↑
Passage Highly migratory sharks are often caught as bycatch in these same tuna fisheries. They do not keep pace: 57% of their assessed stocks are sustainably exploited […] the lack of consistent international management
The report also flags concern over highly migratory sharks, often caught as bycatch in tuna fisheries. While 57 percent of stocks assessed are sustainable, lack of consistent international management continues to hinder recovery efforts.
Source FAO, “FAO releases the most detailed global assessment of marine fish stocks to date”, communiqué de presse, Rome/Nice, 11 June 2025, body of the press release.
Open access open the source · checked on 25 October 2026
- ↑
Passage The term “fish” […] corresponds to no valid taxonomic category […] Sharks […] are biologically more distant from tunas […] than the latter are from tetrapods
Note also that humans are more closely related to bony fishes than either is to sharks. Phylogenetically speaking, “fish” is an invalid category resulting from different rates of morphological change among lineages and does not reflect real relationships.
Source Gregory, T. Ryan, “Understanding Evolutionary Trees”, Evolution: Education and Outreach, vol. 1, no. 2, 2008, p. 121-137, caption of Fig. 10 (section “Misconception #2: Main Line and Side Tracks”).
Open access open the source · checked on 27 October 2026
Bibliography
11
- Clarke, Shelley C. et al., “Global Estimates of Shark Catches Using Trade Records from Commercial Markets”, Ecology Letters, vol. 9, 2006, p. 1115-1126, paywalled (an estimate based on commercial records).
- Dulvy, Nicholas K. et al., “Overfishing Drives Over One-Third of All Sharks and Rays toward a Global Extinction Crisis”, Current Biology, vol. 31, 2021, p. 4773-4787, open access (the assessment of all sharks and rays).
- FAO, La Situation mondiale des pêches et de l’aquaculture 2024, Rome, open access (the differences between areas, the share of major tuna stocks, and the situation of highly migratory sharks; see Entry 2.9). https://www.fao.org/3/cd0683en/online/sofia/2024/status-of-fishery-resources.html
- FAO, “FAO releases the most detailed global assessment of marine fish stocks to date”, communiqué de presse, Rome/Nice, 11 June 2025, open access (presentation of the 2025 Review of the State of World Marine Fishery Resources: highly migratory sharks, often caught accidentally in tuna fisheries, 57% of stocks sustainable, for lack of consistent international management; 87% for tunas). https://www.fao.org/newsroom/detail/fao-releases-the-most-detailed-global-assessment-of-marine-fish-stocks-to-date/en
- Gregory, T. Ryan, “Understanding Evolutionary Trees”, Evolution: Education and Outreach, vol. 1, no. 2, 2008, p. 121-137, open access (“fish” as an invalid category in phylogenetics; humans more closely related to bony fishes than either is to sharks). https://doi.org/10.1007/s12052-008-0035-x
- Liang, Jiayu, “Shark bites consistent with recent trends, with small spike in fatalities”, Florida Museum of Natural History, 5 February 2024, open access (the International Shark Attack File’s 2023 tally: confirmed unprovoked attacks and deaths; what an unprovoked attack is). https://www.floridamuseum.ufl.edu/science/shark-bites-consistent-with-recent-trends-with-small-spike-in-fatalities/
- Nelson, Joseph S., Grande, Terry C. and Wilson, Mark V. H., Fishes of the World, Wiley, 2016, in libraries (why “fish” is not a natural group; cartilaginous fishes and bony fishes).
- Pacoureau, Nathan et al., “Half a Century of Global Decline in Oceanic Sharks and Rays”, Nature, vol. 589, 2021, p. 567-571, paywalled (the 71% decline since 1970; fishing pressure multiplied by eighteen and catches tripled; the 57 series of measurements on 18 species; the 31 oceanic species and the three-quarters threatened; the 1990 break). https://doi.org/10.1038/s41586-020-03173-9
- Tasoff, Harrison, “Unsustainable Fishing of Sharks Is a Global Problem”, UC Santa Barbara, Marine Science Institute, 11 January 2024, open access (presentation of the 2024 study: 101 million sharks killed in 2019 counting catches not identified by species; the hypothesis that the bans created new markets for shark meat). https://msi.ucsb.edu/news/unsustainable-fishing-sharks-global-problem
- Worm, Boris et al., “Global Catches, Exploitation Rates, and Rebuilding Options for Sharks”, Marine Policy, vol. 40, 2013, p. 194-204, paywalled (the ranges of estimates; the exploitation rate compared with the renewal rate).
- Worm, Boris et al., “Global Shark Fishing Mortality Still Rising despite Widespread Regulatory Change”, Science, vol. 383, 2024, p. 225-230, paywalled (the count for 2019; the failure of the bans on removing fins; the coastal rise and the high-seas fall).
Spotted an error or have a doubt? Write to us.