
When you throw a die, there is no knowing what will come up. Over a thousand throws, the outcome can be predicted with astonishing precision.
This whole page lies in that gap.
Repeated chance becomes regular
A single event is unpredictable. An event repeated a great many times becomes, on the contrary, very regular.
Over six throws, it is entirely possible to get no ace at all. Over six thousand throws, you will get about a thousand, since on average one throw in six gives an ace. Not exactly a thousand, but very rarely off by more than sixty.
Interactive
Six dice, or six thousand?
When a die is thrown, there is no knowing what will come up. Over thousands of throws, the share of aces becomes almost predictable.
The question
A die lands on the ace one time in six: is that true over six throws?
What you do Throw 6,000 dice one by one and watch the share of aces narrow. Then throw whole series, as many as you like: each one leaves a dot.
Without JavaScript, here are the animation’s data.
| Throws | Aces expected on average | In 95% of series, number of aces | That is, a share of aces of |
|---|---|---|---|
| 6 | 1 | 0 to 3 | 0 to 50% |
| 60 | 10 | 5 to 16 | 8.3 to 26.7% |
| 600 | 100 | 82 to 118 | 13.7 to 19.7% |
| 6,000 | 1,000 | 944 to 1,057 | 15.7 to 17.6% |
Over 6 throws, there is no ace about one time in three (33%). Over 6,000 throws, the number of aces is more than 60 away from 1,000 in only 3.6% of series: “very rarely”, as the article says.
These figures are calculated exactly (binomial distribution), for a fair die.
The takeaway A small number of throws can give almost anything. The more you throw, the more tightly the share of aces gathers around one in six: this is the law of large numbers.
Sources 1
Bernoulli, Jacques, Ars Conjectandi, Bâle, 1713, public domain ; partie IV traduite en anglais : Sheynin, Oscar, On the Law of Large Numbers, Berlin, 2005, part IV, chapter 4.
even the most stupid person, all by himself and without any preliminary instruction, being guided by some natural instinct […] feels sure that the more such observations are taken into account, the less is the danger of straying from the goal
Public domain and open access open the source · checked on 24 October 2026
The day people decided to calculate chance
For a very long time, chance seemed impossible to measure. What happens by luck happens, and that is all — some even saw fate in it. The idea that it could be calculated is a break, and it can be dated.
In 1654, a Frenchman, the Chevalier de Méré, put a question to a mathematician he knew, Blaise Pascal. Here it is, and it is easy to grasp.1
Two players stake the same sum. The first to win three rounds takes everything. But the game is interrupted at two rounds to one. How should the money be shared?2
Splitting it down the middle is unfair: the one who was leading had a better chance of winning. Giving everything to the one who was leading is unfair too: he had not yet won. So one has to calculate what each would probably have obtained. In other words, to put a number on something that did not happen.
Pascal wrote to another mathematician, Pierre de Fermat, and the two men exchanged letters all summer. This is usually taken as the starting point of the calculus of probabilities.3
A caveat is needed, however. This story is often told as the moment probability was born. But the problem of points has a history before Pascal: Italian authors discussed it throughout the sixteenth century, and one of them, Tartaglia, judged it “more judicial than rational in nature”.4
The regularity has a name
This regularity has a name: the law of large numbers.
Everyone had long suspected it: if you keep throwing a die, the 5 eventually comes up roughly once in six throws. What was difficult was not noticing it, but proving it. A Swiss mathematician, Jacob Bernoulli, managed it, and he said he had kept the solution to himself for twenty years. His book would not appear until 1713, eight years after his death.5
This law explains why insurance exists, why opinion polls more or less work, and why casinos win in the long run without needing to cheat.
It also sheds light on an important point: no one can say what will happen to a particular person. One can only say what happens to many people in their situation. It is not the same thing, and confusing the two is a very common mistake.
Counting letters to break a code
Here is a surprising use of counting, long predating the mathematics of chance.6
In a given language, some letters occur much more often than others. This regularity is invisible in a short sentence, and perfectly stable over a long text.
In the ninth century, the scholar al-Kindi wrote a treatise explaining how to use it to read a coded message. His method: take a long ordinary text in the same language, count its letters, rank them from the most frequent to the rarest; do the same with the enciphered message; then set the two lists side by side.7
The most frequent sign in the message very probably corresponds to the most frequent letter in the language. Step by step, the message is deciphered.
This is already statistical reasoning in embryo, applied long before statistics became a discipline.
Counting people
Counting objects is useful. Counting people is something else.
Very different empires organised censuses: in Babylon, in China, in Egypt, and as far as Peru, where the Incas counted their population in the fourteenth century. In the Andes, numerical information was recorded on knotted cords.8
Two examples show clearly what this was for. In Rome, every five years, citizens were registered to assess their property and the tax they owed. In 1086, the King of England had almost his entire kingdom surveyed, plot by plot, to find out who owned what and how much tax he could draw from it.9
None of these counts was made out of curiosity. People are counted to know how much tax can be raised, how many soldiers can be mobilised, how many hands can be requisitioned.10
Modern censuses appeared only quite late: in Iceland in 1703, in Sweden in 1749, for example. Counting everyone, at regular intervals, is a recent invention.11
In France, the first census of the modern era took place in 1801, the same year as in England and Wales; it counted thirty-three million inhabitants. Since 2004, it has been based on annual data collection.12
Making a table of figures speak
A column of numbers says nothing. The human eye cannot read three hundred numbers in a row.
Giving these numbers a shape — a drawing, a curve, a map — changes everything. All at once you see a trend, a bump, an anomaly.
The most famous example deserves a closer look at the way it is usually told.
In 1854, cholera struck a district of London. A doctor, John Snow, rejected the authorities’ explanation, which blamed poisoned air: for him, cholera travelled through water. He investigated: he compiled the list of the dead, noted where these people lived, and at which pump they fetched their water. He questioned their families. In the end he pointed to one particular water pump, in Broad Street.13
What followed is often told like this: Snow marked the houses of the dead on a map, saw from it where the disease was coming from, removed the handle of the pump, and the epidemic stopped. It is a fine story. It is wrong on two counts.14
First, the map was not used to find the cause: it served above all to show an idea the investigators already had. Second, when the handle of the pump was removed, the epidemic was already on the wane.15
What made the discovery possible was the investigation. The map served to win acceptance for it.
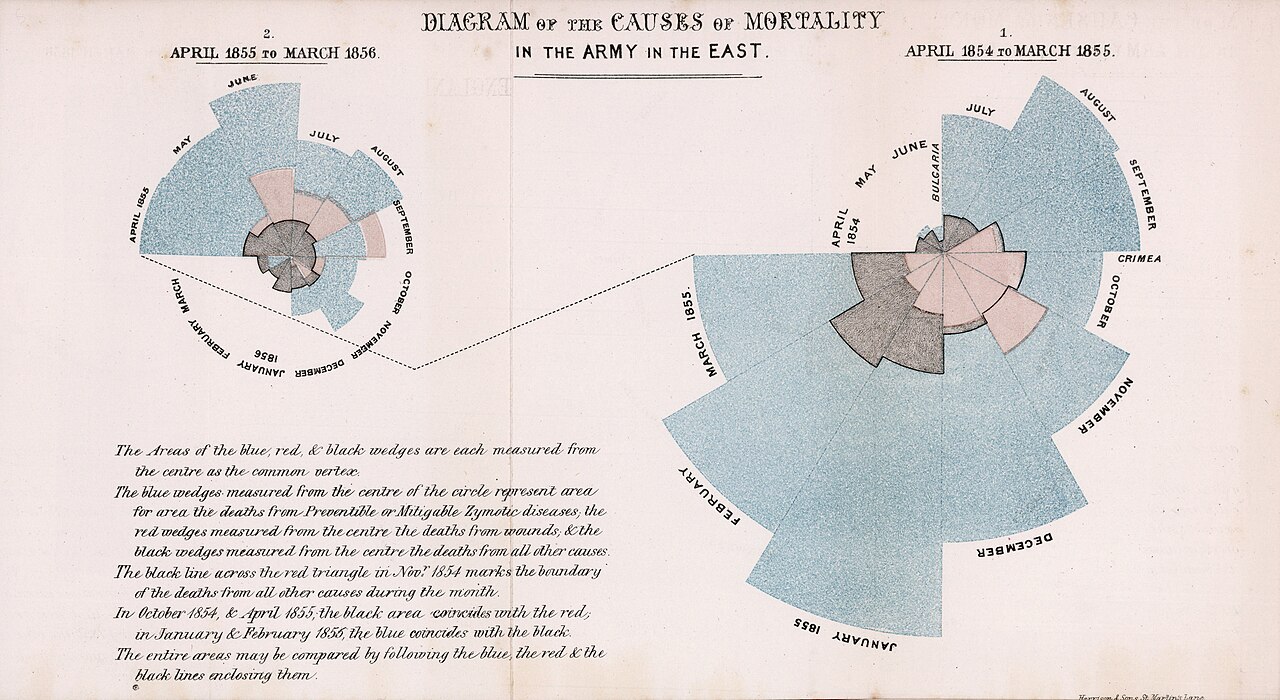
Another famous drawing was put to exactly the same use. During the Crimean War, in the middle of the nineteenth century, Florence Nightingale compiled the figures for the deaths of British soldiers, month by month, separating deaths from wounds received in battle from those due to diseases that could have been prevented.16
Then she drew them. Each month occupies a slice of a disc, and the area of each colour gives the number of deaths. The blue, for preventable diseases, outweighs the red, for wounds.17
Her drawing shows two things at once, and generally only one is remembered.
The first: the soldiers died less from the fighting than from the filth of the hospitals. The second, just as visible in the figure: after the arrival of a sanitary commission, in the middle of the war, the blue collapses. The graph does not merely point to the culprit — it shows that the remedy worked.18
Nightingale did not draw to decorate a report. She drew to persuade the government to improve army hygiene. She had two thousand copies of the report containing these figures printed.19
Two details that show her rigour
The first concerns the drawing itself. Her first version represented the deaths by the length of the radii. She realised that this misled the eye, which looks at areas: if you double the radius of a disc, its area is multiplied by four.20
She first had an erratum slip inserted into the already printed work, then redid the figure entirely, this time calculating the areas.21
She acknowledged the error in her own graph, even though that graph served the cause she was fighting for.22
Interactive
Length or area? The error Nightingale corrected
During the Crimean War, Florence Nightingale gathered the deaths of British soldiers, month by month, and drew each month as a slice of a disc. The choice remains of how the slice grows with the number.
The question
Should a number twice as large get a radius twice as long?
What you do Make the second number grow, from 1 to 4 times the first. On the left, the drawing of the first version (the radius follows the number); on the right, the corrected version (the area follows the number).
Without JavaScript, here are the animation’s data.
| The second number is | Area seen, if the radius follows the number | Area seen, if the area follows the number |
|---|---|---|
| the same as the first | ×1 | ×1 |
| twice the first | ×4 | ×2 |
| three times the first | ×9 | ×3 |
| four times the first | ×16 | ×4 |
The area of a slice of a disc is proportional to the square of its radius: doubling the radius multiplies the area by four. The numbers in the animation are examples, not Nightingale’s figures.
The takeaway The eye compares areas. If the radius follows the number, a number twice as large looks four times as large. To avoid misleading, the area must follow the number.
Sources 2
Small, Hugh, “Florence Nightingale’s Statistical Diagrams”, University of York, Department of Mathematics, description of the diagrams (“bat’s wing”, then “wedges”).
The length of the radial line in each month is proportional to the death rate, […] Florence recognised this error and inserted an erratum slip, but then replaced this diagram in later documents (nos. 3, 4, and 5 listed above) with what I will call the "wedges" diagram. […] In this diagram, Nightingale resolved the problem of the "bat's wing" by using areas to represent the variation in the death rate, instead of the length of radial lines.
Open access open the source · checked on 9 September 2026
Science Museum (Londres), “Florence Nightingale: The Pioneer Statistician”, section “The Crimean war”, then “An analytical approach to medical care”, then “Nightingale’s polar area diagram”.
The Crimean War (1853–6) was the first high-technology conflict of the modern age […] Nightingale set about collecting statistics in Crimea. She treated this activity—counting the number of soldiers killed, injured or diseased […] In her diagram, each wedge represented a month, and the area of the wedge showed the number of soldiers who had died that month.
Open access open the source · checked on 25 October 2026
The second concerns her reply to her opponents. A pamphlet accused her of having exaggerated the number of deaths. In 1859, she published a reply — anonymously — based on the figures the army itself had just made public.23
These figures showed that she had not exaggerated them: she had underestimated them.
So the two must be remembered together. A well-made graph is not an instrument of discovery: it is an argument. You discover by investigating. You draw to be believed.
The flip side must be added at once. A badly made graph — or one made that way on purpose — can make accurate figures say more or less anything. It is enough to choose where the axis starts, which years are shown, which colours are used. A drawing is never neutral.
Counting gives power
One last point remains, and it is a serious one.
Being able to count people means having a hold over them. It has made it possible to organise schools, to detect epidemics, to understand why people were dying. It has also made it possible to tax, and to conscript people by force.
It has served far worse ends.
During the Second World War, in France, the State forced Jewish people to register. Then their names were filed on index cards.
None of this was an accident. In July 1942, the police took out 27,000 of these cards to hand them over to the teams in charge of the arrests. Here, counting served to locate people.24
No computer was needed for that work. The lists that mattered were simple index cards, filed in the card index of the Paris police prefecture.
This is something to remember, and it still holds today: the danger is not in the machine. It is in the question one decides to ask people, and in the act of writing down the answer.
The tools used to measure a society are also used to control it. They are the same tools.
We must go one step further, because the history of these tools is troubling.
Some very useful calculations are used every day by scientists in their research. Two of the best known, correlation and regression, were invented more than a hundred years ago by two scholars, Francis Galton and Karl Pearson.25
But they did not invent them for the sake of mathematics. They were among the most enthusiastic proponents of an idea called eugenics: in their view, certain people should be encouraged to have children, and others discouraged, or even prevented — rather as a breeder chooses his best animals.26
Yet human beings are not livestock, and no one has the right to decide such things for others.
This was not an idea dreamt up on the back of an envelope. In 1911, in London, Pearson became the first holder of a chair in eugenics, funded by Galton’s will — and, the same year, he founded the world’s first department of statistics at the university. He headed it until 1933.27
Today, this idea of sorting human beings is seen for what it is: deeply unjust.
It would be wrong, however, to think that they had invented some neutral tool that was later used for a bad idea. These calculations were shaped for their own question: how far does a child resemble its parents? Measuring the strength of the link between two things is exactly what a correlation coefficient does. The tool was born of that very question.28
It works none the worse for that — indeed, it works very well. Today it is used to treat people and to understand the world. But knowing where the tools we use come from is part of the job.
This does not mean we should stop counting. It means we should always ask who is counting, and what for.
Three different things called “the figures”
| What it is | What it is for | The trap |
|---|---|---|
| A probability | predicting what happens often | it says nothing about a particular case |
| A collected datum | describing what exists | it depends on who decided what to count |
| A graph | making a trend visible | it can be built to convince |
Note 1
En 1654, le problème des partis resurgit dans des conditions assez obscures. Le chevalier de Méré le propose à Pascal
In 1654, the problem of points resurfaced in rather obscure circumstances. The Chevalier de Méré put it to Pascal
Trotignon, Nicolas, Pascal, Fermat et la géométrie du hasard, mémoire, IUFM de Créteil, 1998, preprint arXiv:1309.2824
Note 2
deux joueurs jouent, par exemple, en trois parties, et chacun a mis 32 pistoles au jeu […] Posons que le premier en ait deux et l'autre une
two players play, for example, for three games, and each has staked 32 pistoles […] Let us suppose that the first has two and the other one
Trotignon, Nicolas, Pascal, Fermat et la géométrie du hasard, mémoire, IUFM de Créteil, 1998, preprint arXiv:1309.2824
Note 3
En 1654, le problème est enfin résolu par Pascal, puis, par Fermat, ce qui marque la naissance de la théorie des probabilités […] Le chevalier de Méré le propose à Pascal, qui le résout et le soumet à son tour (par l'entremise de M. de Carcavi) à Fermat, qui le résout lui aussi. […] Pascal à Fermat, 29 juillet 1654. […] Pascal à Fermat, 24 août 1654. […] Fermat à Pascal, 29 août 1654.
In 1654, the problem was finally solved by Pascal, then by Fermat, which marks the birth of the theory of probability […] The Chevalier de Méré put it to Pascal, who solved it and in turn submitted it (through M. de Carcavi) to Fermat, who also solved it. […] Pascal to Fermat, 29 July 1654. […] Pascal to Fermat, 24 August 1654. […] Fermat to Pascal, 29 August 1654.
Trotignon, Nicolas, Pascal, Fermat et la géométrie du hasard, mémoire, IUFM de Créteil, 1998, preprint arXiv:1309.2824
Note 4
Il réapparaît tout au long du XVIe siècle sous la plume de différents auteurs italiens, sans qu'aucun ne parvienne à en donner une solution satisfaisante. […] Ainsi Tartaglia pouvait-il écrire […] La résolution d'une telle question est davantage d'ordre judiciaire que rationnel
It reappears throughout the sixteenth century from the pens of various Italian authors, without any of them managing to give a satisfactory solution. […] Thus Tartaglia could write […] The resolution of such a question is more judicial than rational in nature
Trotignon, Nicolas, Pascal, Fermat et la géométrie du hasard, mémoire, IUFM de Créteil, 1998, preprint arXiv:1309.2824
Note 5
even the most stupid person, all by himself and without any preliminary instruction, being guided by some natural instinct […] feels sure that the more such observations are taken into account, the less is the danger of straying from the goal
Bernoulli, Jacques, Ars Conjectandi, Bâle, 1713, public domain ; partie IV traduite en anglais : Sheynin, Oscar, On the Law of Large Numbers, Berlin, 2005
This, then, is the problem that I decided to make here public after having known its solution for twenty years.
Bernoulli, Jacques, Ars Conjectandi, Bâle, 1713, public domain ; partie IV traduite en anglais : Sheynin, Oscar, On the Law of Large Numbers, Berlin, 2005
Jacob Bernoulli's most original work was Ars Conjectandi published in Basel in 1713, eight years after his death.
O’Connor, John J. and Robertson, Edmund F., “Jacob Bernoulli”, MacTutor History of Mathematics, University of St Andrews
Note 6
In his founding "Manuscript on Deciphering Cryptographic Messages", Ya‛kūb ibn Isḥāq Al Kindī (ca. 801‒873) wrote the following (Mrayati et al. 2002, 122):
Ycart, Bernard, “Letter counting: a stem cell for Cryptology, Quantitative Linguistics, and Statistics”, preprint arXiv:1211.6847, 2012
Note 7
In his founding “Manuscript on Deciphering Cryptographic Messages”, Ya‛kūb ibn Isḥāq Al Kindī (ca. 801‒873) […] The clearest exposition of the method may be the first one, by Al Kindī (Mrayati et al. 2002, 124): Among the expedients we use in cryptanalysing a cryptogram if the language is already known, is to acquire a fairly long plaintext in that language, and count the number of each of its letters.
Ycart, Bernard, “Letter counting: a stem cell for Cryptology, Quantitative Linguistics, and Statistics”, preprint arXiv:1211.6847, 2012
acquire a fairly long plaintext in that language […] count the number of each of its letters. We mark the most frequent letter ʿfirstʾ, the second most frequent ʿsecondʾ, and the following one ʿthirdʾ […] searching for the most frequent symbol of the cryptogram […] we regard it as being the same letter we have marked ʿfirstʾ in the plaintext […] until we exhaust all the symbols used in this cryptogram sought for cryptanalysis.
Ycart, Bernard, “Letter counting: a stem cell for Cryptology, Quantitative Linguistics, and Statistics”, preprint arXiv:1211.6847, 2012
Note 8
The Babylonians and Chinese, for example, held censuses primarily for military conscription and taxation.
Northern Ireland Statistics and Research Agency (NISRA), “History of the census”
de l'Égypte (1ère dynastie) vers 2750 av. J.-C. […] On sait aussi qu'au Pérou, au XIVe siècle, les Incas procédaient à des recensements.
of Egypt (1st dynasty) around 2750 BC […] It is also known that in Peru, in the fourteenth century, the Incas carried out censuses.
Godinot, Alain, Pour comprendre le recensement de la population, Insee, coll. “Insee Méthodes”, hors-série, 2005
The name for this as-of-yet undeciphered recording device, which will be the subject of my talk today, is the khipu—a knotted-string register that served as the functional analogue to writing during the Inka Empire, between 1400–1532 AD. […] In the canonical form, each hanging pendant cord registered a single numerical value, which would allow us to define the lower bound of an Inka-style khipu’s contents as a collection of numbers.
Medrano, Manuel, “Knot Just Numbers: Mathematics and More in Andean Khipu Strings”, lecture, Gresham College, 20 October 2021, transcript
Note 9
Roman authorities carried out a census every five years to assess citizens’ property and tax obligations.
Northern Ireland Statistics and Research Agency (NISRA), “History of the census”
In 1086, King William I (the Conqueror) wanted to find out about all the land in his new kingdom: who owned which property, who else lived there, how much the land was worth and therefore how much tax he could charge […] Domesday Book describes almost all of England
The National Archives (Royaume-Uni), “Domesday Book”, ressource pédagogique
Note 10
les premières grandes civilisations dont nous avons connaissance pratiquaient des dénombrements de leur population. […] notamment pour des raisons fiscales ou militaires.
the first great civilisations of which we have knowledge carried out counts of their population. […] notably for fiscal or military reasons.
Godinot, Alain, Pour comprendre le recensement de la population, Insee, coll. “Insee Méthodes”, hors-série, 2005
In ancient Egypt, population data helped organise labour for pyramid construction
Northern Ireland Statistics and Research Agency (NISRA), “History of the census”
Note 11
One of the earliest censuses reflecting these modern principles was conducted in Quebec and Nova Scotia in 1665, […] Iceland implemented a census in 1703, Germany in 1742, and Sweden in 1749.
Northern Ireland Statistics and Research Agency (NISRA), “History of the census”
Note 12
Le premier recensement de l'ère moderne a eu lieu en 1801. […] le recensement repose sur une collecte d'information annuelle
The first census of the modern era took place in 1801. […] the census relies on an annual collection of information
Institut national de la statistique et des études économiques (Insee), “Recensement de la population”, fiche de métadonnées
Parliament passed the Census Act in 1800, and the first official census of England and Wales was conducted on 10 March 1801.
Northern Ireland Statistics and Research Agency (NISRA), “History of the census”
le premier recensement de l'ère moderne, qui établit la population française d'alors à 33 millions d'habitants.
the first census of the modern era, which put the French population of the time at 33 million inhabitants.
Godinot, Alain, Pour comprendre le recensement de la population, Insee, coll. “Insee Méthodes”, hors-série, 2005
Note 13
I requested permission, therefore, to take a list, at the General Register Office, of the deaths from cholera
Snow, John, On the Mode of Communication of Cholera, 2ᵉ éd., John Churchill, Londres, 1855
the families of the deceased persons informed me that they always sent to the pump in Broad Street
Snow, John, On the Mode of Communication of Cholera, 2ᵉ éd., John Churchill, Londres, 1855
On proceeding to the spot, I found that nearly all the deaths had taken place within a short distance of the pump
Snow, John, On the Mode of Communication of Cholera, 2ᵉ éd., John Churchill, Londres, 1855
Showing the deaths from cholera in Broad Street, Golden Square, and the neighbourhood, from 19th August to 30th September 1854. […] The most terrible outbreak of cholera which ever occurred in this kingdom, is probably that which took place in Broad Street, Golden Square, and the adjoining streets, a few weeks ago.
Snow, John, On the Mode of Communication of Cholera, 2ᵉ éd., John Churchill, Londres, 1855
Snow deduced that the transmission of the disease across greater distances was due to drinking water […] By contrast, the Committee on Scientific Inquiries of the General Board of Health flatly rejected the pump theory […] insisted that some concentrated noxious atmospheric influence, no doubt emanating from putrefying organic matter, was the cause of the Golden Square outbreak
Frerichs, Ralph R., “Map, Myth and Error Making in BS Pump Outbreak”, site John Snow, UCLA Fielding School of Public Health, Department of Epidemiology
Note 14
Modern writers persist in disseminating not the facts but an apocryphal story to support a desired conclusion, as in this representative example: [Snow] sat down one afternoon with a map of London, […] He marked the locations of the homes of those who had died. From the marks on his map, Snow could see that the deaths had all occurred in the so-called Golden Square area. […] he removed the handle of the Broad Street pump. Once the pump was out of commission, the epidemic abated.
Frerichs, Ralph R., “Map, Myth and Error Making in BS Pump Outbreak”, site John Snow, UCLA Fielding School of Public Health, Department of Epidemiology
Note 15
The map did not give rise to the insight, but rather it tended to confirm theories already held by the various investigators.
Frerichs, Ralph R., “Map, Myth and Error Making in BS Pump Outbreak”, John Snow website, UCLA Fielding School of Public Health, Department of Epidemiology, n.d.
That this is a mistake is sufficiently shown by the following table which, though incomplete, proves that the outbreak had already reached its climax, and had been steadily on the decline for several days before the pump-handle was removed.
Frerichs, Ralph R., “Handle Removal, Index Case and Rev. Whitehead”, John Snow website, UCLA Fielding School of Public Health, Department of Epidemiology, n.d.
The map did not give rise to the insight, but rather it tended to confirm theories already held by the various investigators.
Frerichs, Ralph R., “Map, Myth and Error Making in BS Pump Outbreak”, site John Snow, UCLA Fielding School of Public Health, Department of Epidemiology
There is no doubt that the mortality was much diminished, as I said before, by the flight of the population, which commenced soon after the outbreak; but the attacks had so far diminished before the use of the water was stopped, that it is impossible to decide whether the well still contained the cholera poison in an active state, or whether, from some cause, the water had become free from it.
Snow, John, On the Mode of Communication of Cholera, 2ᵉ éd., John Churchill, Londres, 1855
Note 16
The blue area showed deaths from preventable diseases picked up in the terrible conditions at the Crimea. Red sections showed deaths from battlefield wounds.
Science Museum (Londres), “Florence Nightingale: The Pioneer Statistician”
The Crimean War (1853–6) was the first high-technology conflict of the modern age […] Nightingale set about collecting statistics in Crimea. She treated this activity—counting the number of soldiers killed, injured or diseased […] In her diagram, each wedge represented a month, and the area of the wedge showed the number of soldiers who had died that month.
Science Museum (Londres), “Florence Nightingale: The Pioneer Statistician”
Note 17
In her diagram, each wedge represented a month, and the area of the wedge showed the number of soldiers who had died that month. The blue area showed deaths from preventable diseases picked up in the terrible conditions at the Crimea. Red sections showed deaths from battlefield wounds. […] more soldiers died from preventable diseases during the war than from injuries.
Science Museum (Londres), “Florence Nightingale: The Pioneer Statistician”
Note 18
The scandal she uncovered was that more soldiers were killed by preventable diseases caused by unsanitary healthcare than as a result of battlefield wounds. […] Readers could see two things. The first was that the reforms Nightingale implemented and campaigned for had made a huge positive difference to mortality. The second, and more shocking result, was that more soldiers died from preventable diseases during the war than from injuries.
Science Museum (Londres), “Florence Nightingale: The Pioneer Statistician”
The diagram illustrates how the Sanitary Commission, sent out in the middle of the war, dramatically reduced the death rate.
Small, Hugh, “Florence Nightingale’s Statistical Diagrams”, University of York, Department of Mathematics
Note 19
to persuade the Government to improve army hygiene
Small, Hugh, “Florence Nightingale’s Statistical Diagrams”, University of York, Department of Mathematics
She produced 2000 copies of this book.
Small, Hugh, “Florence Nightingale’s Statistical Diagrams”, University of York, Department of Mathematics
Note 20
The first is what Nightingale called the "bat's wing" which is very gloomy to look at and also misleading. […] but both the text and the appearance imply that it is the shaded area that is proportional to the death rate, rather than the length of the radial lines. Florence recognised this error
Small, Hugh, “Florence Nightingale’s Statistical Diagrams”, University of York, Department of Mathematics
Note 21
The length of the radial line in each month is proportional to the death rate, […] Florence recognised this error and inserted an erratum slip, but then replaced this diagram in later documents (nos. 3, 4, and 5 listed above) with what I will call the "wedges" diagram. […] In this diagram, Nightingale resolved the problem of the "bat's wing" by using areas to represent the variation in the death rate, instead of the length of radial lines.
Small, Hugh, “Florence Nightingale’s Statistical Diagrams”, University of York, Department of Mathematics
Note 22
She used recent data to persuade the Government to improve army hygiene. […] The diagram illustrates how the Sanitary Commission, sent out in the middle of the war, dramatically reduced the death rate. […] Florence recognised this error and inserted an erratum slip
Small, Hugh, “Florence Nightingale’s Statistical Diagrams”, University of York, Department of Mathematics
Note 23
A Contribution to the Sanitary History of the British Army (1859). Nightingale published this anonymously to answer a pamphlet that claimed that she had exaggerated the number of deaths in the war. She showed that the Army's own figures, released in late 1858, showed that on the contrary she had underestimated.
Small, Hugh, “Florence Nightingale’s Statistical Diagrams”, University of York, Department of Mathematics
Note 24
plusieurs mois après le recensement de la fin 1940, ont reçu un simple « billet vert » à leur domicile. […] La rafle des 16-17 juillet 1942 se situe donc après les premières déportations de Juifs en France […] À cette occasion, on a retiré rien moins que 27 000 fiches de Juifs (recensés en application des lois de Vichy) d'un fichier de la préfecture de police (le fichier « Tulard »), de manière à pouvoir les distribuer, sur le terrain, aux équipes policières chargées des arrestations.
several months after the census at the end of 1940, received a simple “green ticket” at their homes. […] The round-up of 16-17 July 1942 thus came after the first deportations of Jews in France […] On this occasion, no fewer than 27,000 cards of Jews (registered under the Vichy laws) were removed from a card index of the police prefecture (the “Tulard” index), so that they could be distributed, on the ground, to the police teams in charge of the arrests.
Singer, Claude, “Les grandes rafles de Juifs en France”, Les Chemins de la mémoire, no. 119, juillet-August 2002, repris sur le site du ministère des Armées
Note 25
it was the imagination of Sir Francis Galton that originally conceived modern notions of correlation and regression […] In 1896, Pearson published his first rigorous treatment of correlation and regression
Stanton, Jeffrey M., “Galton, Pearson, and the Peas: A Brief History of Linear Regression for Statistics Instructors”, Journal of Statistics Education, vol. 9, no. 3, 2001
Note 26
This included a discussion of how animal breeders had improved species by selective breeding, and set Galton and others thinking about the possibility of improving the human stock by similar means. […] Galton's ideas included "positive eugenics" – encouraging the right people to breed - and "negative eugenics" – discouraging the wrong people from breeding. […] These ideas, and especially those of negative eugenics were to lead to policies such as the compulsory sterilisation in many countries of people with disabilities […] Galton and Pearson were not by any means alone in their support for eugenics, but it is fair to say that they were among its most enthusiastic proponents.
University College London, Department of Statistical Science, “Our history”
Note 27
The department that now bears the name of Statistical Science was founded in 1911 by Karl Pearson as the Department of Applied Statistics. It was the first university department of Statistics in the world. […] When Galton died in 1911 he left money in his will to the University of London to found a Chair in Eugenics, with the recommendation that Karl Pearson should be the first holder of the chair. Pearson was duly appointed and founded the Department of Applied Statistics at UCL.
University College London, Department of Statistical Science, “Our history”
Pearson retired in 1933, handing over the headship of the Statistics Department to his son, Egon Pearson.
University College London, Department of Statistical Science, “Our history”
Note 28
The thoughts that prompted the development of the PPMC began with a then vexing problem of heredity -- understanding how strongly the characteristics of one generation of living things manifested in the following generation.
Stanton, Jeffrey M., “Galton, Pearson, and the Peas: A Brief History of Linear Regression for Statistics Instructors”, Journal of Statistics Education, vol. 9, no. 3, 2001
Galton's fascination with genetics and heredity provided the initial inspiration that led to regression and the PPMC.
Stanton, Jeffrey M., “Galton, Pearson, and the Peas: A Brief History of Linear Regression for Statistics Instructors”, Journal of Statistics Education, vol. 9, no. 3, 2001
Notes and sources
- ↑
Passage In 1654, a Frenchman, the Chevalier de Méré, put a question to a mathematician he knew, Blaise Pascal.
En 1654, le problème des partis resurgit dans des conditions assez obscures. Le chevalier de Méré le propose à Pascal
Editors’ translation In 1654, the problem of points resurfaced in rather obscure circumstances. The Chevalier de Méré put it to Pascal
Source Trotignon, Nicolas, Pascal, Fermat et la géométrie du hasard, mémoire, IUFM de Créteil, 1998, preprint arXiv:1309.2824, introduction, “Les sources utilisées”.
Open access open the source · checked on 24 October 2026
- ↑
Passage Two players stake the same sum. The first to win three rounds takes everything. But the game is interrupted at two rounds to one.
deux joueurs jouent, par exemple, en trois parties, et chacun a mis 32 pistoles au jeu […] Posons que le premier en ait deux et l'autre une
Editors’ translation two players play, for example, for three games, and each has staked 32 pistoles […] Let us suppose that the first has two and the other one
Source Trotignon, Nicolas, Pascal, Fermat et la géométrie du hasard, mémoire, IUFM de Créteil, 1998, preprint arXiv:1309.2824, letter from Pascal to Fermat of 29 July 1654, quoted in the dissertation.
Open access open the source · checked on 24 October 2026
- ↑
Passage Pascal wrote to another mathematician, Pierre de Fermat, and the two men exchanged letters all summer. This is usually taken as the starting point of the calculus of probabilities.
En 1654, le problème est enfin résolu par Pascal, puis, par Fermat, ce qui marque la naissance de la théorie des probabilités […] Le chevalier de Méré le propose à Pascal, qui le résout et le soumet à son tour (par l'entremise de M. de Carcavi) à Fermat, qui le résout lui aussi. […] Pascal à Fermat, 29 juillet 1654. […] Pascal à Fermat, 24 août 1654. […] Fermat à Pascal, 29 août 1654.
Editors’ translation In 1654, the problem was finally solved by Pascal, then by Fermat, which marks the birth of the theory of probability […] The Chevalier de Méré put it to Pascal, who solved it and in turn submitted it (through M. de Carcavi) to Fermat, who also solved it. […] Pascal to Fermat, 29 July 1654. […] Pascal to Fermat, 24 August 1654. […] Fermat to Pascal, 29 August 1654.
Source Trotignon, Nicolas, Pascal, Fermat et la géométrie du hasard, mémoire, IUFM de Créteil, 1998, preprint arXiv:1309.2824, introduction, then “Les sources utilisées” (list of letters).
Open access open the source · checked on 9 September 2026
- ↑
Passage But the problem of points has a history before Pascal: Italian authors discussed it throughout the sixteenth century, and one of them, Tartaglia, judged it “more judicial than rational in nature”.
Il réapparaît tout au long du XVIe siècle sous la plume de différents auteurs italiens, sans qu'aucun ne parvienne à en donner une solution satisfaisante. […] Ainsi Tartaglia pouvait-il écrire […] La résolution d'une telle question est davantage d'ordre judiciaire que rationnel
Editors’ translation It reappears throughout the sixteenth century from the pens of various Italian authors, without any of them managing to give a satisfactory solution. […] Thus Tartaglia could write […] The resolution of such a question is more judicial than rational in nature
Source Trotignon, Nicolas, Pascal, Fermat et la géométrie du hasard, mémoire, IUFM de Créteil, 1998, preprint arXiv:1309.2824, introduction.
Open access open the source · checked on 24 October 2026
- ↑
Passage Everyone had long suspected it
even the most stupid person, all by himself and without any preliminary instruction, being guided by some natural instinct […] feels sure that the more such observations are taken into account, the less is the danger of straying from the goal
Source Bernoulli, Jacques, Ars Conjectandi, Bâle, 1713, public domain ; partie IV traduite en anglais : Sheynin, Oscar, On the Law of Large Numbers, Berlin, 2005, part IV, chapter 4.
Public domain and open access open the source · checked on 24 October 2026
Passage A Swiss mathematician, Jacob Bernoulli, managed it, and he said he had kept the solution to himself for twenty years.
This, then, is the problem that I decided to make here public after having known its solution for twenty years.
Source Bernoulli, Jacques, Ars Conjectandi, Bâle, 1713, public domain ; partie IV traduite en anglais : Sheynin, Oscar, On the Law of Large Numbers, Berlin, 2005, part IV.
Public domain and open access open the source · checked on 24 October 2026
Passage His book would not appear until 1713, eight years after his death.
Jacob Bernoulli's most original work was Ars Conjectandi published in Basel in 1713, eight years after his death.
Source O’Connor, John J. and Robertson, Edmund F., “Jacob Bernoulli”, MacTutor History of Mathematics, University of St Andrews, biography.
Open access open the source · checked on 24 October 2026
- ↑
Passage Here is a surprising use of counting, long predating the mathematics of chance.
In his founding "Manuscript on Deciphering Cryptographic Messages", Ya‛kūb ibn Isḥāq Al Kindī (ca. 801‒873) wrote the following (Mrayati et al. 2002, 122):
Source Ycart, Bernard, “Letter counting: a stem cell for Cryptology, Quantitative Linguistics, and Statistics”, preprint arXiv:1211.6847, 2012, introduction (p. 1).
Open access open the source · checked on 25 October 2026
- ↑
Passage In the ninth century, the scholar al-Kindi wrote a treatise explaining how to use it to read a coded message.
In his founding “Manuscript on Deciphering Cryptographic Messages”, Ya‛kūb ibn Isḥāq Al Kindī (ca. 801‒873) […] The clearest exposition of the method may be the first one, by Al Kindī (Mrayati et al. 2002, 124): Among the expedients we use in cryptanalysing a cryptogram if the language is already known, is to acquire a fairly long plaintext in that language, and count the number of each of its letters.
Source Ycart, Bernard, “Letter counting: a stem cell for Cryptology, Quantitative Linguistics, and Statistics”, preprint arXiv:1211.6847, 2012, p. 1, introduction, 1st paragraph; p. 4, section “Cryptology: don’t spare either labor or paper”, quotation of al-Kindi from Mrayati et al. 2002, p. 124.
Open access open the source · checked on 27 October 2026
Passage His method: take a long ordinary text in the same language, count its letters, rank them from the most frequent to the rarest; do the same with the enciphered message; then set the two lists side by side. […] The most frequent sign in the message very probably corresponds to the most frequent letter in the language. Step by step, the message is deciphered.
acquire a fairly long plaintext in that language […] count the number of each of its letters. We mark the most frequent letter ʿfirstʾ, the second most frequent ʿsecondʾ, and the following one ʿthirdʾ […] searching for the most frequent symbol of the cryptogram […] we regard it as being the same letter we have marked ʿfirstʾ in the plaintext […] until we exhaust all the symbols used in this cryptogram sought for cryptanalysis.
Source Ycart, Bernard, “Letter counting: a stem cell for Cryptology, Quantitative Linguistics, and Statistics”, preprint arXiv:1211.6847, 2012, p. 4, section “Cryptology: don’t spare either labor or paper”, quotation from al-Kindi (translation by Mrayati et al. 2002, p. 124).
Open access open the source · checked on 25 October 2026
- ↑
Passage Very different empires organised censuses: in Babylon, in China
The Babylonians and Chinese, for example, held censuses primarily for military conscription and taxation.
Source Northern Ireland Statistics and Research Agency (NISRA), “History of the census”, section on ancient censuses.
Open access open the source · checked on 24 October 2026
Passage in Egypt, and as far as Peru, where the Incas counted their population in the fourteenth century
de l'Égypte (1ère dynastie) vers 2750 av. J.-C. […] On sait aussi qu'au Pérou, au XIVe siècle, les Incas procédaient à des recensements.
Editors’ translation of Egypt (1st dynasty) around 2750 BC […] It is also known that in Peru, in the fourteenth century, the Incas carried out censuses.
Source Godinot, Alain, Pour comprendre le recensement de la population, Insee, coll. “Insee Méthodes”, hors-série, 2005, appendix A1, “Le recensement de la population dans l’Histoire”.
Open access open the source · checked on 24 October 2026
Passage In the Andes, numerical information was recorded on knotted cords.
The name for this as-of-yet undeciphered recording device, which will be the subject of my talk today, is the khipu—a knotted-string register that served as the functional analogue to writing during the Inka Empire, between 1400–1532 AD. […] In the canonical form, each hanging pendant cord registered a single numerical value, which would allow us to define the lower bound of an Inka-style khipu’s contents as a collection of numbers.
Source Medrano, Manuel, “Knot Just Numbers: Mathematics and More in Andean Khipu Strings”, lecture, Gresham College, 20 October 2021, transcript, transcript, p. 1 (introduction), then p. 3, paragraph “Arranged in horizontal levels like in the diagram…”.
Open access open the source · checked on 27 October 2026
- ↑
Passage In Rome, every five years, citizens were registered to assess their property and the tax they owed.
Roman authorities carried out a census every five years to assess citizens’ property and tax obligations.
Source Northern Ireland Statistics and Research Agency (NISRA), “History of the census”, section on ancient censuses.
Open access open the source · checked on 24 October 2026
Passage In 1086, the King of England had almost his entire kingdom surveyed, plot by plot, to find out who owned what and how much tax he could draw from it.
In 1086, King William I (the Conqueror) wanted to find out about all the land in his new kingdom: who owned which property, who else lived there, how much the land was worth and therefore how much tax he could charge […] Domesday Book describes almost all of England
Source The National Archives (Royaume-Uni), “Domesday Book”, ressource pédagogique, introduction (“What can we learn about England in the 11th century?”) and section “Background”.
Open access open the source · checked on 24 October 2026
- ↑
Passage People are counted to know how much tax can be raised, how many soldiers can be mobilised
les premières grandes civilisations dont nous avons connaissance pratiquaient des dénombrements de leur population. […] notamment pour des raisons fiscales ou militaires.
Editors’ translation the first great civilisations of which we have knowledge carried out counts of their population. […] notably for fiscal or military reasons.
Source Godinot, Alain, Pour comprendre le recensement de la population, Insee, coll. “Insee Méthodes”, hors-série, 2005, appendix A1, “Le recensement de la population dans l’Histoire”.
Open access open the source · checked on 24 October 2026
Passage how many hands can be requisitioned
In ancient Egypt, population data helped organise labour for pyramid construction
Source Northern Ireland Statistics and Research Agency (NISRA), “History of the census”, section on ancient censuses.
Open access open the source · checked on 24 October 2026
- ↑
Passage Modern censuses appeared only quite late: in Iceland in 1703, in Sweden in 1749, for example.
One of the earliest censuses reflecting these modern principles was conducted in Quebec and Nova Scotia in 1665, […] Iceland implemented a census in 1703, Germany in 1742, and Sweden in 1749.
Source Northern Ireland Statistics and Research Agency (NISRA), “History of the census”, section on the first modern censuses.
Open access open the source · checked on 24 October 2026
- ↑
Passage In France, the first census of the modern era took place in 1801 […] Since 2004, it has been based on annual data collection.
Le premier recensement de l'ère moderne a eu lieu en 1801. […] le recensement repose sur une collecte d'information annuelle
Editors’ translation The first census of the modern era took place in 1801. […] the census relies on an annual collection of information
Source Institut national de la statistique et des études économiques (Insee), “Recensement de la population”, fiche de métadonnées, history of the source.
Open access open the source · checked on 24 October 2026
Passage the same year as in England and Wales
Parliament passed the Census Act in 1800, and the first official census of England and Wales was conducted on 10 March 1801.
Source Northern Ireland Statistics and Research Agency (NISRA), “History of the census”, section on the British census.
Open access open the source · checked on 24 October 2026
Passage it counted thirty-three million inhabitants
le premier recensement de l'ère moderne, qui établit la population française d'alors à 33 millions d'habitants.
Editors’ translation the first census of the modern era, which put the French population of the time at 33 million inhabitants.
Source Godinot, Alain, Pour comprendre le recensement de la population, Insee, coll. “Insee Méthodes”, hors-série, 2005, appendix A1, “Le recensement de la population dans l’Histoire”.
Open access open the source · checked on 24 October 2026
- ↑
Passage he compiled the list of the dead
I requested permission, therefore, to take a list, at the General Register Office, of the deaths from cholera
Source Snow, John, On the Mode of Communication of Cholera, 2ᵉ éd., John Churchill, Londres, 1855, chapter on the Broad Street outbreak.
Public domain open the source · checked on 24 October 2026
Passage and at which pump they fetched their water. He questioned their families.
the families of the deceased persons informed me that they always sent to the pump in Broad Street
Source Snow, John, On the Mode of Communication of Cholera, 2ᵉ éd., John Churchill, Londres, 1855, chapter on the Broad Street outbreak.
Public domain open the source · checked on 24 October 2026
Passage noted where these people lived […] In the end he pointed to one particular water pump, in Broad Street.
On proceeding to the spot, I found that nearly all the deaths had taken place within a short distance of the pump
Source Snow, John, On the Mode of Communication of Cholera, 2ᵉ éd., John Churchill, Londres, 1855, chapter on the Broad Street outbreak.
Public domain open the source · checked on 24 October 2026
Passage In 1854, cholera struck a district of London
Showing the deaths from cholera in Broad Street, Golden Square, and the neighbourhood, from 19th August to 30th September 1854. […] The most terrible outbreak of cholera which ever occurred in this kingdom, is probably that which took place in Broad Street, Golden Square, and the adjoining streets, a few weeks ago.
Source Snow, John, On the Mode of Communication of Cholera, 2ᵉ éd., John Churchill, Londres, 1855, list of maps (preliminary pages); “The Cholera Near Golden Square”, p. 38.
Public domain open the source · checked on 9 September 2026
Passage A doctor, John Snow, rejected the authorities’ explanation, which blamed poisoned air: for him, cholera travelled through water.
Snow deduced that the transmission of the disease across greater distances was due to drinking water […] By contrast, the Committee on Scientific Inquiries of the General Board of Health flatly rejected the pump theory […] insisted that some concentrated noxious atmospheric influence, no doubt emanating from putrefying organic matter, was the cause of the Golden Square outbreak
Source Frerichs, Ralph R., “Map, Myth and Error Making in BS Pump Outbreak”, site John Snow, UCLA Fielding School of Public Health, Department of Epidemiology, section “Snow’s investigation”, then section “The later "Government" maps”.
Open access open the source · checked on 25 October 2026
- ↑
Passage What followed is often told like this: Snow marked the houses of the dead on a map, saw from it where the disease was coming from, removed the handle of the pump, and the epidemic stopped.
Modern writers persist in disseminating not the facts but an apocryphal story to support a desired conclusion, as in this representative example: [Snow] sat down one afternoon with a map of London, […] He marked the locations of the homes of those who had died. From the marks on his map, Snow could see that the deaths had all occurred in the so-called Golden Square area. […] he removed the handle of the Broad Street pump. Once the pump was out of commission, the epidemic abated.
Source Frerichs, Ralph R., “Map, Myth and Error Making in BS Pump Outbreak”, site John Snow, UCLA Fielding School of Public Health, Department of Epidemiology, section “Map-making and myth-making in Broad Street Pump Outbreak”, “Introduction” (extract from Brody et al., The Lancet, 2000).
Open access open the source · checked on 25 October 2026
- ↑
Passage the map was not used to find the cause: it served above all to show an idea the investigators already had
The map did not give rise to the insight, but rather it tended to confirm theories already held by the various investigators.
Source Frerichs, Ralph R., “Map, Myth and Error Making in BS Pump Outbreak”, John Snow website, UCLA Fielding School of Public Health, Department of Epidemiology, n.d., “Stream 2 – f” page.
Open access open the source · checked on 27 October 2026
Passage the epidemic was already on the wane
That this is a mistake is sufficiently shown by the following table which, though incomplete, proves that the outbreak had already reached its climax, and had been steadily on the decline for several days before the pump-handle was removed.
Source Frerichs, Ralph R., “Handle Removal, Index Case and Rev. Whitehead”, John Snow website, UCLA Fielding School of Public Health, Department of Epidemiology, n.d., “Stream 2 – e” page (“Handle Removal, Index Case and Rev. Whitehead”), passage quoting the Rev. Henry Whitehead (1867).
Open access open the source · checked on 27 October 2026
Passage the map was not used to find the cause: it served above all to show an idea the investigators already had
The map did not give rise to the insight, but rather it tended to confirm theories already held by the various investigators.
Source Frerichs, Ralph R., “Map, Myth and Error Making in BS Pump Outbreak”, site John Snow, UCLA Fielding School of Public Health, Department of Epidemiology, text by Brody et al. reproduced on the page.
Open access open the source · checked on 25 October 2026
Passage when the handle of the pump was removed, the epidemic was already on the wane
There is no doubt that the mortality was much diminished, as I said before, by the flight of the population, which commenced soon after the outbreak; but the attacks had so far diminished before the use of the water was stopped, that it is impossible to decide whether the well still contained the cholera poison in an active state, or whether, from some cause, the water had become free from it.
Source Snow, John, On the Mode of Communication of Cholera, 2ᵉ éd., John Churchill, Londres, 1855, section “The pump-well in Broad Street, Golden Square”, p. 51.
Public domain open the source · checked on 25 October 2026
- ↑
Passage separating deaths from wounds received in battle from those due to diseases that could have been prevented
The blue area showed deaths from preventable diseases picked up in the terrible conditions at the Crimea. Red sections showed deaths from battlefield wounds.
Source Science Museum (Londres), “Florence Nightingale: The Pioneer Statistician”, section “Nightingale’s polar area diagram”.
Open access open the source · checked on 24 October 2026
Passage During the Crimean War, in the middle of the nineteenth century, Florence Nightingale compiled the figures for the deaths of British soldiers, month by month […] Each month occupies a slice of a disc
The Crimean War (1853–6) was the first high-technology conflict of the modern age […] Nightingale set about collecting statistics in Crimea. She treated this activity—counting the number of soldiers killed, injured or diseased […] In her diagram, each wedge represented a month, and the area of the wedge showed the number of soldiers who had died that month.
Source Science Museum (Londres), “Florence Nightingale: The Pioneer Statistician”, section “The Crimean war”, then “An analytical approach to medical care”, then “Nightingale’s polar area diagram”.
Open access open the source · checked on 25 October 2026
- ↑
Passage the area of each colour gives the number of deaths. The blue, for preventable diseases, outweighs the red, for wounds.
In her diagram, each wedge represented a month, and the area of the wedge showed the number of soldiers who had died that month. The blue area showed deaths from preventable diseases picked up in the terrible conditions at the Crimea. Red sections showed deaths from battlefield wounds. […] more soldiers died from preventable diseases during the war than from injuries.
Source Science Museum (Londres), “Florence Nightingale: The Pioneer Statistician”, section “Nightingale’s polar area diagram”.
Open access open the source · checked on 9 September 2026
- ↑
Passage Her drawing shows two things at once […] the soldiers died less from the fighting than from the filth of the hospitals […] it shows that the remedy worked.
The scandal she uncovered was that more soldiers were killed by preventable diseases caused by unsanitary healthcare than as a result of battlefield wounds. […] Readers could see two things. The first was that the reforms Nightingale implemented and campaigned for had made a huge positive difference to mortality. The second, and more shocking result, was that more soldiers died from preventable diseases during the war than from injuries.
Source Science Museum (Londres), “Florence Nightingale: The Pioneer Statistician”, sections “The Crimean war” and “Nightingale’s polar area diagram”.
Open access open the source · checked on 9 September 2026
Passage after the arrival of a sanitary commission, in the middle of the war, the blue collapses
The diagram illustrates how the Sanitary Commission, sent out in the middle of the war, dramatically reduced the death rate.
Source Small, Hugh, “Florence Nightingale’s Statistical Diagrams”, University of York, Department of Mathematics, description of the “bat’s wing” diagram (documents 1 and 2).
Open access open the source · checked on 24 October 2026
- ↑
Passage She drew to persuade the government to improve army hygiene.
to persuade the Government to improve army hygiene
Source Small, Hugh, “Florence Nightingale’s Statistical Diagrams”, University of York, Department of Mathematics, introduction.
Open access open the source · checked on 24 October 2026
Passage She had two thousand copies of the report containing these figures printed.
She produced 2000 copies of this book.
Source Small, Hugh, “Florence Nightingale’s Statistical Diagrams”, University of York, Department of Mathematics, description of the five documents.
Open access open the source · checked on 24 October 2026
- ↑
Passage She realised that this misled the eye, which looks at areas
The first is what Nightingale called the "bat's wing" which is very gloomy to look at and also misleading. […] but both the text and the appearance imply that it is the shaded area that is proportional to the death rate, rather than the length of the radial lines. Florence recognised this error
Source Small, Hugh, “Florence Nightingale’s Statistical Diagrams”, University of York, Department of Mathematics, description of the “bat’s wing” diagram (documents 1 and 2).
Open access open the source · checked on 25 October 2026
- ↑
Passage Her first version represented the deaths by the length of the radii […] She first had an erratum slip inserted into the already printed work, then redid the figure entirely, this time calculating the areas.
The length of the radial line in each month is proportional to the death rate, […] Florence recognised this error and inserted an erratum slip, but then replaced this diagram in later documents (nos. 3, 4, and 5 listed above) with what I will call the "wedges" diagram. […] In this diagram, Nightingale resolved the problem of the "bat's wing" by using areas to represent the variation in the death rate, instead of the length of radial lines.
Source Small, Hugh, “Florence Nightingale’s Statistical Diagrams”, University of York, Department of Mathematics, description of the diagrams (“bat’s wing”, then “wedges”).
Open access open the source · checked on 9 September 2026
- ↑
Passage She acknowledged the error in her own graph, even though that graph served the cause she was fighting for.
She used recent data to persuade the Government to improve army hygiene. […] The diagram illustrates how the Sanitary Commission, sent out in the middle of the war, dramatically reduced the death rate. […] Florence recognised this error and inserted an erratum slip
Source Small, Hugh, “Florence Nightingale’s Statistical Diagrams”, University of York, Department of Mathematics, introduction, then description of the “bat’s wing” diagram.
Open access open the source · checked on 25 October 2026
- ↑
Passage A pamphlet accused her of having exaggerated the number of deaths. In 1859, she published a reply — anonymously […] she had underestimated them.
A Contribution to the Sanitary History of the British Army (1859). Nightingale published this anonymously to answer a pamphlet that claimed that she had exaggerated the number of deaths in the war. She showed that the Army's own figures, released in late 1858, showed that on the contrary she had underestimated.
Source Small, Hugh, “Florence Nightingale’s Statistical Diagrams”, University of York, Department of Mathematics, description of the five documents, document 3.
Open access open the source · checked on 9 September 2026
- ↑
Passage the State forced Jewish people to register. Then their names were filed on index cards. […] In July 1942, the police took out 27,000 of these cards to hand them over to the teams in charge of the arrests. Here, counting served to locate people. […] The lists that mattered were simple index cards, filed in the card index of the Paris police prefecture.
plusieurs mois après le recensement de la fin 1940, ont reçu un simple « billet vert » à leur domicile. […] La rafle des 16-17 juillet 1942 se situe donc après les premières déportations de Juifs en France […] À cette occasion, on a retiré rien moins que 27 000 fiches de Juifs (recensés en application des lois de Vichy) d'un fichier de la préfecture de police (le fichier « Tulard »), de manière à pouvoir les distribuer, sur le terrain, aux équipes policières chargées des arrestations.
Editors’ translation several months after the census at the end of 1940, received a simple “green ticket” at their homes. […] The round-up of 16-17 July 1942 thus came after the first deportations of Jews in France […] On this occasion, no fewer than 27,000 cards of Jews (registered under the Vichy laws) were removed from a card index of the police prefecture (the “Tulard” index), so that they could be distributed, on the ground, to the police teams in charge of the arrests.
Source Singer, Claude, “Les grandes rafles de Juifs en France”, Les Chemins de la mémoire, no. 119, juillet-August 2002, repris sur le site du ministère des Armées, sections “Les rafles de 1941”, then “La rafle du Vél’ d’Hiv”.
Open access open the source · checked on 25 October 2026
- ↑
Passage Two of the best known, correlation and regression, were invented more than a hundred years ago by two scholars, Francis Galton and Karl Pearson.
it was the imagination of Sir Francis Galton that originally conceived modern notions of correlation and regression […] In 1896, Pearson published his first rigorous treatment of correlation and regression
Source Stanton, Jeffrey M., “Galton, Pearson, and the Peas: A Brief History of Linear Regression for Statistics Instructors”, Journal of Statistics Education, vol. 9, no. 3, 2001, section 1, “Introduction”, then section 4, “Pearson’s Mathematical Development of Correlation and Regression”.
Open access open the source · checked on 25 October 2026
- ↑
Passage They were among the most enthusiastic proponents of an idea called eugenics: in their view, certain people should be encouraged to have children, and others discouraged, or even prevented — rather as a breeder chooses his best animals.
This included a discussion of how animal breeders had improved species by selective breeding, and set Galton and others thinking about the possibility of improving the human stock by similar means. […] Galton's ideas included "positive eugenics" – encouraging the right people to breed - and "negative eugenics" – discouraging the wrong people from breeding. […] These ideas, and especially those of negative eugenics were to lead to policies such as the compulsory sterilisation in many countries of people with disabilities […] Galton and Pearson were not by any means alone in their support for eugenics, but it is fair to say that they were among its most enthusiastic proponents.
Source University College London, Department of Statistical Science, “Our history”, section “The Early History of the Department of Statistics” (Galton), then section “The historical context”.
Open access open the source · checked on 25 October 2026
- ↑
Passage In 1911, in London, Pearson became the first holder of a chair in eugenics, funded by Galton’s will — and, the same year, he founded the world’s first department of statistics at the university.
The department that now bears the name of Statistical Science was founded in 1911 by Karl Pearson as the Department of Applied Statistics. It was the first university department of Statistics in the world. […] When Galton died in 1911 he left money in his will to the University of London to found a Chair in Eugenics, with the recommendation that Karl Pearson should be the first holder of the chair. Pearson was duly appointed and founded the Department of Applied Statistics at UCL.
Source University College London, Department of Statistical Science, “Our history”, history of the department (first paragraph, then paragraph on Galton).
Open access open the source · checked on 24 October 2026
Passage He headed it until 1933.
Pearson retired in 1933, handing over the headship of the Statistics Department to his son, Egon Pearson.
Source University College London, Department of Statistical Science, “Our history”, history of the department.
Open access open the source · checked on 24 October 2026
- ↑
Passage These calculations were shaped for their own question: how far does a child resemble its parents? Measuring the strength of the link between two things is exactly what a correlation coefficient does.
The thoughts that prompted the development of the PPMC began with a then vexing problem of heredity -- understanding how strongly the characteristics of one generation of living things manifested in the following generation.
Source Stanton, Jeffrey M., “Galton, Pearson, and the Peas: A Brief History of Linear Regression for Statistics Instructors”, Journal of Statistics Education, vol. 9, no. 3, 2001, section 1, “Introduction”.
Open access open the source · checked on 24 October 2026
Passage The tool was born of that very question.
Galton's fascination with genetics and heredity provided the initial inspiration that led to regression and the PPMC.
Source Stanton, Jeffrey M., “Galton, Pearson, and the Peas: A Brief History of Linear Regression for Statistics Instructors”, Journal of Statistics Education, vol. 9, no. 3, 2001, section 1, “Introduction”.
Open access open the source · checked on 24 October 2026
Bibliography
25
- Al-Kindi, Ya’qub ibn Ishaq, Risala fi Istikhraj al-Mu’amma [Traité sur le déchiffrement des messages cryptographiques], IXᵉ siècle, public domain ; édition critique et traduction : Mrayati, Mohammed, Alam, Yahya Meer et at-Tayyan, Mohammed Hassan, Al-Kindi’s Treatise on Cryptanalysis, King Faisal Center, Riyad, 2003, in libraries.
- Baruch, Marc-Olivier, Servir l’État français : l’administration en France de 1940 à 1944, Fayard, 1997, in libraries (card indexes and censuses under Vichy).
- Bernoulli, Jacques, Ars Conjectandi, Bâle, 1713, public domain ; partie IV traduite en anglais : Sheynin, Oscar, On the Law of Large Numbers, Berlin, 2005, open access (published posthumously; the first proven statement of the law of large numbers; the intuition everyone has of it; the solution known to the author for twenty years). https://gtfp.cs.rhul.ac.uk/sheynin/008_bernoulli.pdf
- Frerichs, Ralph R., “Handle Removal, Index Case and Rev. Whitehead”, John Snow website, UCLA Fielding School of Public Health, Department of Epidemiology, n.d., open access (the removal of the handle on 8 September 1854; the Rev. Whitehead’s table showing that the epidemic had been declining for several days, from 143 fatal attacks on 1 September to 12 on the 8th). https://epi-snow.ph.ucla.edu/Stream2_BSPoutbreak_e.html
- Frerichs, Ralph R., “Map, Myth and Error Making in BS Pump Outbreak”, John Snow website, UCLA Fielding School of Public Health, Department of Epidemiology, n.d., open access (draws on Brody, Howard et al., “Map-making and myth-making in Broad Street: the London cholera epidemic, 1854”, The Lancet, vol. 356, no. 9223, 2000: the legendary account of the map and the handle; Snow and waterborne transmission; the “atmospheric influence” favoured by the General Board of Health; the map confirming theories already formed). https://epi-snow.ph.ucla.edu/Stream2_BSPoutbreak_f.html
- Frerichs, Ralph R., “Map, Myth and Error Making in BS Pump Outbreak”, site John Snow, UCLA Fielding School of Public Health, Department of Epidemiology, s. d., open access (draws on Brody, Howard et al., “Map-making and myth-making in Broad Street: the London cholera epidemic, 1854”, The Lancet, vol. 356, no. 9223, 2000: the legendary account of the map and the handle; Snow and transmission through water; the “atmospheric influence” favoured by the General Board of Health). https://epi-snow.ph.ucla.edu/Stream2_BSPoutbreak_f.html
- Godinot, Alain, Pour comprendre le recensement de la population, Insee, coll. “Insee Méthodes”, hors-série, 2005, open access (appendix A1, “Le recensement de la population dans l’Histoire”: the population counts of the first civilisations, the censuses of the Incas, the first census of the modern era in 1801 and its 33 million inhabitants). https://www.insee.fr/fr/information/2579979
- Institut national de la statistique et des études économiques (Insee), “Recensement de la population”, fiche de métadonnées, open access (the first census of the modern era, in 1801; the annual collection since 2004). https://www.insee.fr/fr/metadonnees/source/serie/s1321
- MacKenzie, Donald A., Statistics in Britain, 1865-1930: The Social Construction of Scientific Knowledge, Edinburgh University Press, 1981, in libraries (Galton, Pearson, eugenics and the invention of the correlation coefficient).
- Medrano, Manuel, “Knot Just Numbers: Mathematics and More in Andean Khipu Strings”, lecture, Gresham College, 20 October 2021, transcript, open access (the khipu, a knotted-string register of the Inka Empire, 1400-1532; each pendant cord records a numerical value). https://www.gresham.ac.uk/sites/default/files/transcript/2021-10-20-1600_MEDRANO_BSHM-T.pdf
- Nightingale, Florence, Notes on Matters Affecting the Health, Efficiency, and Hospital Administration of the British Army, Harrison and Sons, 1858, public domain ; et A Contribution to the Sanitary History of the British Army, 1859, public domain (the diagram of the causes of mortality; the anonymous reply to the pamphlet accusing her of exaggeration).
- Northern Ireland Statistics and Research Agency (NISRA), “History of the census”, open access (the censuses of Babylon, China, Egypt and Rome, and what they were for; the first modern censuses, including Iceland in 1703 and Sweden in 1749; the first official census of England and Wales, in 1801). https://www.nisra.gov.uk/statistics/census/history-census
- O’Connor, John J. and Robertson, Edmund F., “Jacob Bernoulli”, MacTutor History of Mathematics, University of St Andrews, open access (the mathematician from Basel; the Ars Conjectandi, published in Basel in 1713, eight years after the author’s death). https://mathshistory.st-andrews.ac.uk/Biographies/Bernoulli_Jacob/
- Pascal, Blaise and Fermat, Pierre de, correspondance de l’été 1654 sur le problème des partis, public domain, reproduite dans Pascal, Blaise, Œuvres complètes, Gallimard, “Pléiade”, 1954.
- Science Museum (Londres), “Florence Nightingale: The Pioneer Statistician”, open access (the two lessons of the diagram: the predominance of preventable diseases and the effect of the sanitary reforms). https://www.sciencemuseum.org.uk/objects-and-stories/florence-nightingale-pioneer-statistician
- Singer, Claude, “Les grandes rafles de Juifs en France”, Les Chemins de la mémoire, no. 119, juillet-August 2002, repris sur le site du ministère des Armées, open access (the census of Jews at the end of 1940; the 27,000 cards from the card index of the police prefecture handed over to the arrest teams in July 1942). https://www.defense.gouv.fr/chemins-memoire/histoire-memoires/ressources-historiques/seconde-guerre-mondiale/sort-juifs-tsiganes-0
- Small, Hugh, “Florence Nightingale’s Statistical Diagrams”, University of York, Department of Mathematics, open access (the five documents in which these figures appear; the switch from the length of the radii to areas; the two thousand copies of the 1858 report; the sanitary commission; the demonstration, in 1859, that she had underestimated the deaths). https://www.york.ac.uk/depts/maths/histstat/small.htm
- Snow, John, On the Mode of Communication of Cholera, 2ᵉ éd., John Churchill, Londres, 1855, public domain (the list of deaths requested from the General Register Office; the deaths clustered around the Broad Street pump; what the families said; the removal of the handle). https://www.gutenberg.org/ebooks/72894
- Stanton, Jeffrey M., “Galton, Pearson, and the Peas: A Brief History of Linear Regression for Statistics Instructors”, Journal of Statistics Education, vol. 9, no. 3, 2001, open access (heredity, Galton’s starting point for regression and correlation; Pearson’s first rigorous treatment, in 1896). https://jse.amstat.org/v9n3/stanton.html
- The National Archives (Royaume-Uni), “Domesday Book”, ressource pédagogique, open access (the survey of 1086: who owned what, what the land was worth, the tax the king could draw from it; the regions left out). https://www.nationalarchives.gov.uk/education/resources/domesday-book/
- Trotignon, Nicolas, Pascal, Fermat et la géométrie du hasard, mémoire, IUFM de Créteil, 1998, preprint arXiv:1309.2824, open access (Pascal’s letter about the Chevalier de Méré and the interrupted game; the history of the problem of points before Pascal). https://arxiv.org/pdf/1309.2824
- University College London, Department of Statistical Science, “Our history”, open access (Galton, Pearson and eugenics; the chair in eugenics bequeathed by Galton, the first university department of statistics founded by Pearson in 1911, his retirement in 1933). https://www.ucl.ac.uk/mathematical-physical-sciences/statistics/about-us/our-history
- Urton, Gary, Signs of the Inka Khipu: Binary Coding in the Andean Knotted-String Records, University of Texas Press, 2003, in libraries (khipus, knotted cords used to record numbers; see Entry 9.1).
- Vinten-Johansen, Peter et al., Cholera, Chloroform, and the Science of Medicine: A Life of John Snow, Oxford University Press, 2003, in libraries (the 1854 investigation, the map published after the event, the decline of the epidemic before the removal of the handle).
- Ycart, Bernard, “Letter counting: a stem cell for Cryptology, Quantitative Linguistics, and Statistics”, preprint arXiv:1211.6847, 2012, open access (al-Kindi, c. 801-873; the English translation of his letter-counting method, after Mrayati et al.). https://arxiv.org/pdf/1211.6847
Spotted an error or have a doubt? Write to us.